SharePoint
Over the years, I authored many SharePoint-related posts. This category contains many posts related to Microsoft 365, Office 365, SharePoint, and related technologies.

The Future of SharePoint - it's here! Paid Members Public
Today Microsoft announced "The Future of SharePoint" at one of their events. This is a big step in the right direction for many reasons, and in this post I'll try to explain my take on why I like what I'm seeing. Microsoft is really

Office 365 Dev Tip - Getting Add-in (App) Information for Add-ins (Apps) on a specific Web Paid Members Public
Here’s yet another quick tip for the CSOM developer in SharePoint online. I came across a discussion about retrieving information about which apps were used/installed on a certain site. There’s a lot of people who want a simple indicator, notification/alert or list when new apps are

Office 365 Dev Tip - Getting all Apps from your Tenant App Catalog using the Office 365 (CSOM) API Paid Members Public
Here’s another quick-tip when working with Office 365 dev / SharePoint Online CSOM. A lot of people have asked me by e-mail, comments and twitter on how to get information about their apps in their tenants programmatically. With that, I thought it’d be fun to post another code snippet
Office 365 Dev Tip - Retrieve all tenant-level WebTemplates in your Office 365 tenant using CSOM Paid Members Public
Here’s another simple and quick tip for Office 365 dev (with SharePoint Online). In this post I’ll simply show how you can easily get the Tenant-level Web Templates and information about then. In recent weeks, this topic has been cause of many discussions I’ve had with people
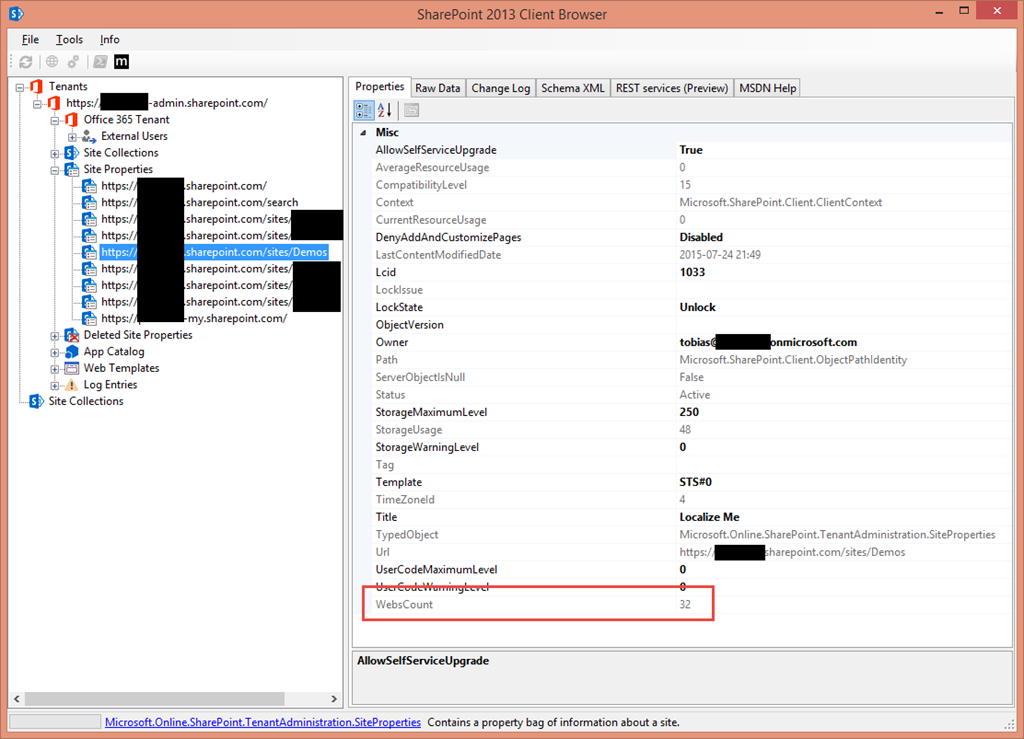
Office 365 Dev Tip - Get Subsite Count per Site Collection with the Office 365 (CSOM) API Paid Members Public
Here’s a quick tip for when working with the .NET managed CSOM for Office 365 dev (with SharePoint Online). In a few cases and projects I’ve been involved with, I see code that iterates through each site collection and then iterates through each Web recursively in order to
Highlights from the recent announcements at BUILD 2015 Paid Members Public
With the BUILD 2015 [http://www.buildwindows.com/] conference last week we got a load of announcements from Microsoft. Some entirely new information and some redundant information from previous announcements. In this post I’ll highlight the things I consider to be the most inspiring and forward announcements of the

Microsoft MVP Virtual Conference in May 2015–A free online conference Paid Members Public
There’s a lot of conferences happening right now. Last week was Build, this week is Ignite – in only 10 days it’s time for the “2015 Microsoft MVP Virtual Conference” which is a free event to join online. This is called the MVP Virtual Conference [http://mvp.microsoft.com/
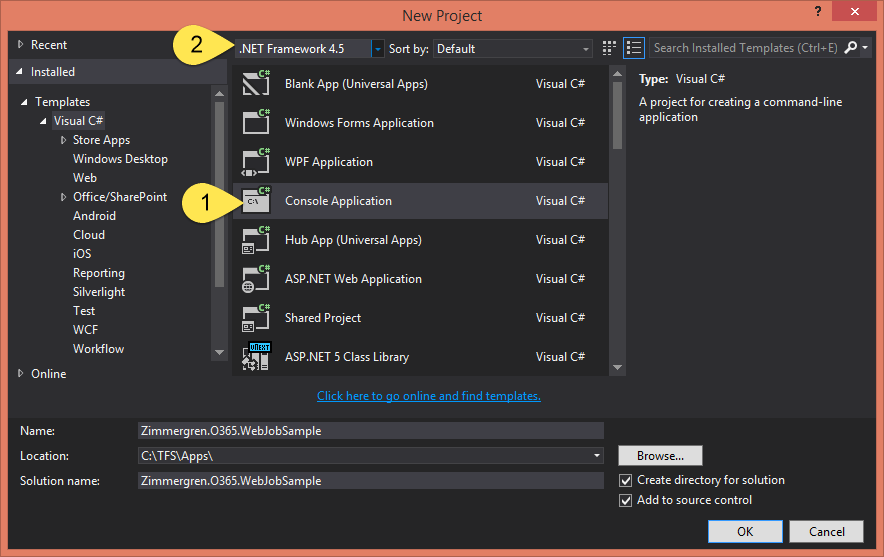
Getting Started with building Azure WebJobs ("Timer Jobs") for your Office 365 sites Paid Members Public
One of my new Office 365 projects is all about migrating farm-solutions to a more Office 365 compliant format. This includes converting a lot of functionality to SharePoint Apps and other cloud-friendly formats. One of the things we’ve got plenty of is Timer Jobs. In this post I’ll


Recent comments