Getting Started with Application Insights with Visual Studio 2015 for your ASP.NET Web Applications
Disclaimer: This post was written 2014-11-13, while the Application Insights were still in Beta/Preview.
Changes will most likely happen, and therefore some information below may have changed by the time you read this.
Introduction to Microsoft Application Insights
One of the really cool features that was recently announced by Microsoft is the Application Insights integration with Visual Studio 2015. Don’t confuse this with reporting provided by services like Google Analytics, which only use client-side reporting capabilities. This is full server-side awesomeness which can report the health of your specific service or application directly, having the reports instantaneously accessible in your Azure Portal.
The mobile projects I’m currently building with Xamarin have a backend hosted with Azure Mobile Services. I’ve used Xamarin Insights for mobile-app insights and reporting to get nice reports and insights in how my apps are behaving and being used. With the recent announcement of the Microsoft Application Insights integration into Visual Studio 2015 (preview), we can now easily add Insights to our Azure Mobile Services projects in order to keep measures on the server-side of your apps as well.
Note: Insights has been around for a while, and if you downloaded an extension for Visual Studio 2013 Update 3, you could add insights to your project as well – now it’s fully integrated into VS 2015, which is awesome.
Application Insights. We released Application Insights first as an extension and then integrated with Visual Studio 2013 in Update 3. We’ve now fully integrated Application Insights into Visual Studio 2015 to make it easy for you to add monitoring to your projects and we’ve smoothed the workflow to publish to an Azure website. Visit the Azure website to get started and learn more about Application Insights.
– Visual Studio Team Blog
Adding Application Insights to your Visual Studio 2015 project
Let’s get started with the technical details directly here. We really want to dig into how we can add insights into our existing or new projects, so here’s a step-by-step guide for doing so.
Add Application Insights to a new ASP.NET project
If you’re creating a new Visual Studio 2015 project make sure to tick the “Add Application Insights to Project” checkbox in the Create-dialog, as seen in this screenshot:
[ et/content/images/2014/11/image.png)
… or Add Application Insights to an existing project…
If you’re adding insights to an existing project, make sure you right-click your project and choose “Add Application Insights Telemetry…” as seen here:
[ et/content/images/2014/11/image1.png)
After you’ve added the Application Insights to your project you’ll see that it automatically adds references to three new assemblies for the Application Insights.
- Microsoft.ApplicationInsights
- Microsoft.ApplicationInsights.Extensibility.RuntimeTelemetry
- Microsoft.ApplicationInsights.Extensibility.Web
[ et/content/images/2014/11/image2.png)
Well, that’s it really. At least for getting started. You can now start reviewing your performance, usage and exceptions etc in your projects when you launch your site the next time.
View Application Insights reports for your application
So once we’ve added Application Insights to our project, we need to review the results somewhere. The easiest thing to do is to right-click your project and choose “Open Application Insights“:
[ et/content/images/2014/11/image3.png)
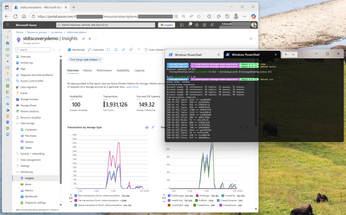
This will open your browser and direct you to your Azure Portal, pulling up the UI for your new Insights application:
[ et/content/images/2014/11/image4.png)
At this point, there’s not really any data to analyze or get insights into because drumroll we haven’t launched it for the first time so no usage or data has been collected.
Add some code that will fail deliberately
In order to really see that Application Insights work, and to see that it has pretty granular reports in the UI I will add some basic fubar code which will crash my web app:
```
File: ApplicationInsightsDemo_Snippet1.cs
private void BtnFail_Click(object sender, EventArgs e)
{ throw new Exception("Oh noes, the application went boom"); } ```
Launch your application and make sure to navigate around a bit, posting various requests. In my sample I’ve got the BtnFail (as seen above) which will simply throw an exception. I’ve clicked that a few times for this demo.
See your Application Insights, live while debugging
From Visual Studio 2015 you can choose to view Application Insights from the toolbar and also configure if you want to see notifications:
[ et/content/images/2014/11/image5.png)
A notification will look like this in VS 2015:
[ et/content/images/2014/11/image6.png)
You could of course also just right-click your project and choose “Open Application Insights” if you’re not debugging.
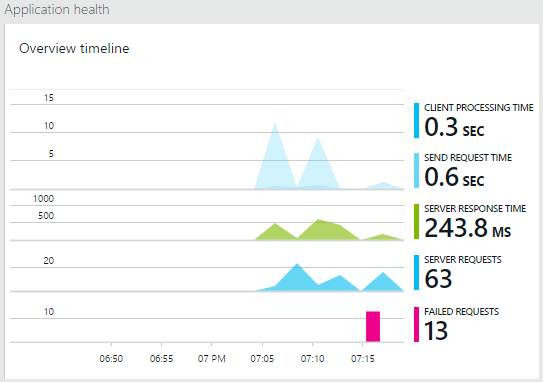
Application Insights data overview
My Azure Portal is opened when clicking the aforementioned button, where I instantaneously can review my Application Insights:
[ et/content/images/2014/11/image7.png)
And if I click the “Failed Requests” data row it’ll show detailed information about what actually happened with those failed requests:
[ et/content/images/2014/11/image8.png)
You can see what request caused it (in my case the /Default page) and what type of failed request it was (in my case an Exception).
Here, I’ve clicked the System.Web.HttpUnhandledException row just to drill down into that data:
[ et/content/images/2014/11/image9.png)
You can then click one of the exceptions to drill down even deeper in to that specific occurrence of the exception:
[ et/content/images/2014/11/image10.png)
Should you need to, you can even click the […] button just below “Device Id” and you’ll get a complete list of details for the client device:
[ et/content/images/2014/11/image11.png)
Summary
That’s it for an introduction to getting some telemetry (word of the week) in your applications. Not only can you easily add this to new web applications, it’s also very easy to add into existing applications.
If you are running Visual Studio 2013, there’s an extension you can download which handles Application Insights for you, but with Visual Studio 2015 this is fully integrated.


Recent comments