I’m excited to share a new tool I’ve been working on!
If you’re in the Microsoft for Startups program, you get a nice chunk of Azure credits. That’s great. What’s not so great is that the portal gives you very little insight into how those credits are actually being spent over time. You can export a CSV, and that’s about it.
So I built something to help with that.
Azure Startup Credits Visualizer
The Azure Startup Credits Visualizer takes your cost export CSV and turns it into an interactive report with charts, heatmaps, trend analysis, and cost breakdowns.
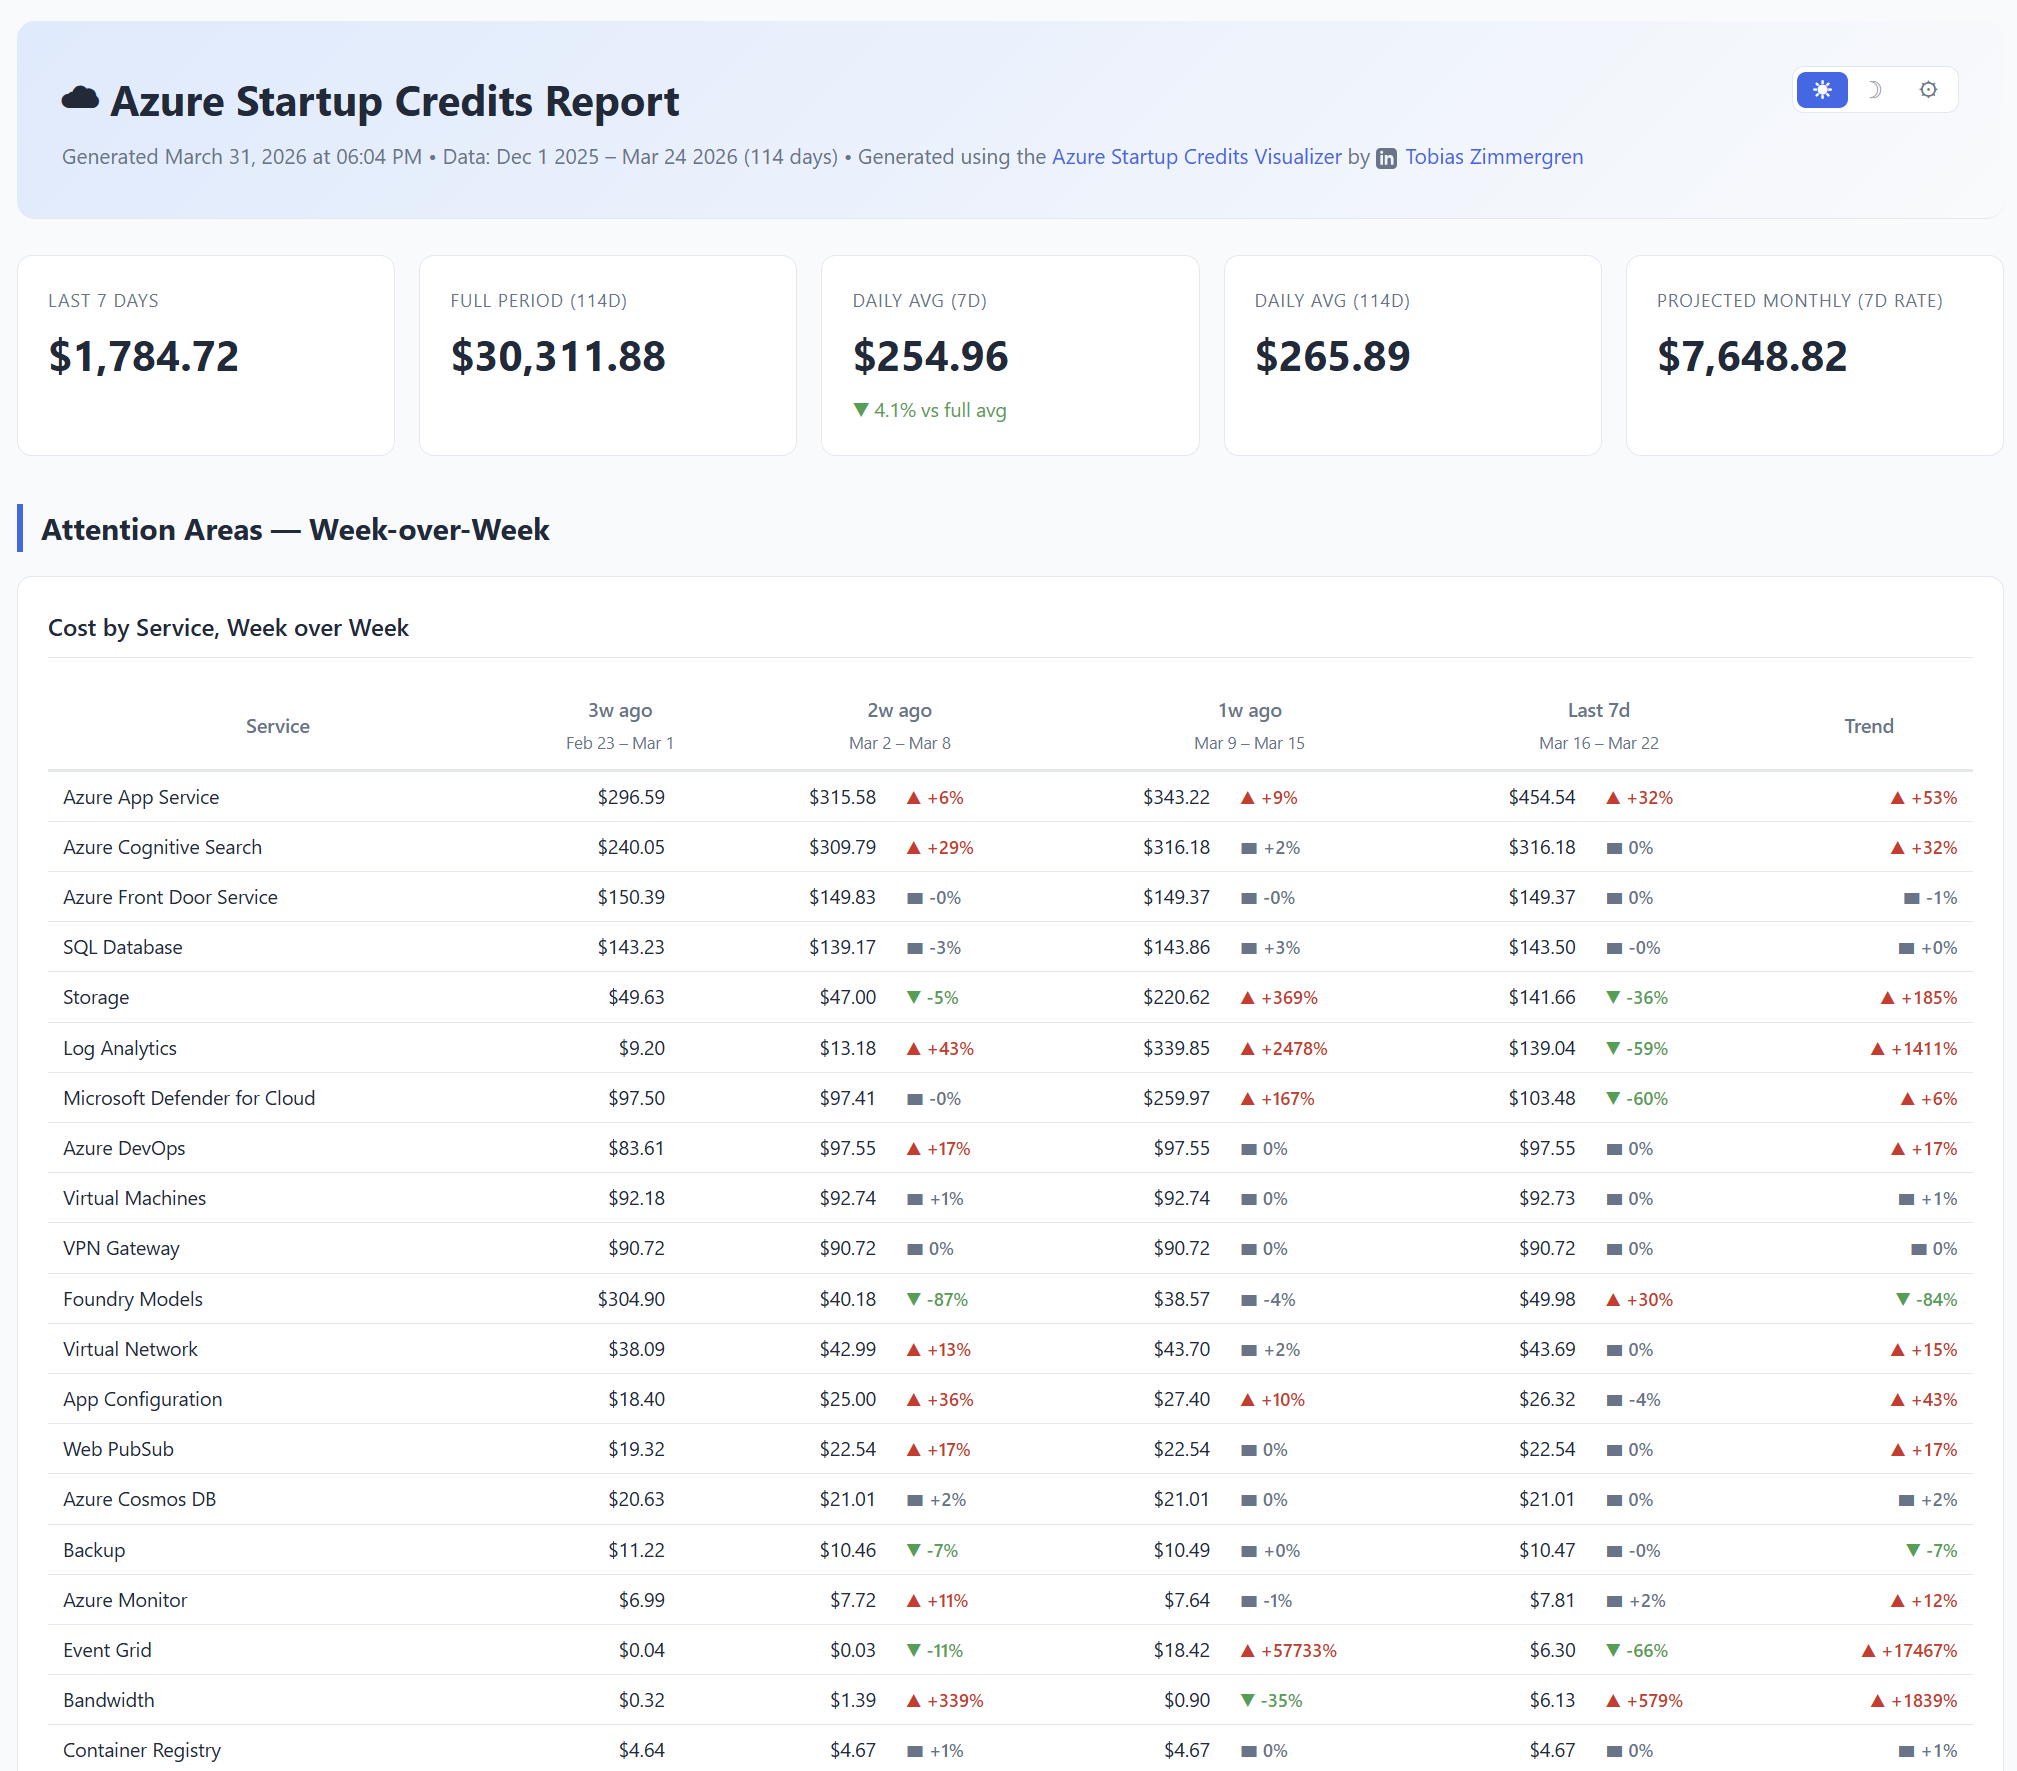
Upload your CSV, and you immediately get answers to questions like:
- How fast are we burning through credits?
- Which services cost the most?
- Are there spending spikes I should look into?
- What does the week-over-week trend look like?
No more wrestling with spreadsheets to figure this out.
Why I built this
At pons.io we’re in the Microsoft for Startups program, and I found myself repeatedly exporting CSVs and trying to make sense of the raw data. The portal just doesn’t give you the visualization you need to make quick decisions about your spending.
I wanted something where I could drag a file onto a page and instantly see the full picture. So I built it.
100% in-browser, zero server calls
Since it might be considered sensitive information, I also designed ot so your data never leaves your machine.
The tool runs entirely client-side in your browser. There are no APIs, no backend, no telemetry on your uploaded data. The app is a static site hosted on Azure Static Web Apps. It serves HTML, CSS, and JavaScript. That’s it. Once the page loads, you could unplug your network cable and it would still work.
Your CSV gets parsed in-memory with JavaScript, the charts render locally, and nothing is sent anywhere. No CDNs connected. Close the tab and it’s all gone, unless you opt to download the HTML report, in which case that happens all locally, too.
How to use it
- Go to azcredits.zimmergren.net
- Export your cost CSV from the Microsoft for Startups portal
- Drop the file onto the page (or click to browse)
- Explore your report
You can also download the generated report as a self-contained HTML file to share with your team.
Give it a try
Head over to azcredits.zimmergren.net and try it out. I’d love to hear what you think!
Comments are closed