This post is about increasing automated security posture with Azure DevOps by using the “Microsoft Security Code Analysis extension”, which is a set of tasks that helps implement security analysis of your files and code in your pipelines.
Microsoft have done an amazing job with making this extension available, so we can make use of automated build tasks to check for some commonly encountered security issues.
Follow me in this article to explore how we make use of the Azure DevOps extension for Microsoft Security Code Analysis, which includes these build tasks to help us:
- Credential Scanner (CredScan)
- BinSkim
- TSLint
- Roslyn Analyzers
- Microsoft Security Risk Detection (Deprecated June 2020)
- Anti-Malware Scanner
To try and paint a picture of what I will demonstrate, I’ll line up an example scenario where I already know I have some files that contains some security issues.
The Microsoft Security Code Analysis tools have a lot more power built-in than these build tasks I’m showing right now. I will cover some other aspects in other posts in this blog.
Scenario: Ensure all new and existing code is more secure
I have created a scenario in which I have a set of files that contains some sensitive details, like account keys and passwords, and some certificate (.pem) files. I’ve done this in hope of enforcing the tools to fail the DevOps pipelines to stop any of these sensitive artifacts to be pushed onward to any releases.
Here’s my first file, which is a C# file named lazy-consts.cs with some credentials:
// For demo purposes.
namespace Zimmergren.CredScanDemo
{
    public class Consts
    {
        // A lazy dev has put real credentials into the code base.
        public static string StorageAccountKey = "AV6PFXi5f4AtrnN5qJVRbT5Dms5Cx1u8IlylqUh7xvJKFmfDffZLX/GICSkqwL/0FKpl9lTts14k1X/dcd4kcQ==";
        public static string ApiManagementKey = "k6O+lGA7pBJ/3ffjDyeYtKRygmQlWCkbepb9twuQUnYNjJmuOEzs5ZlPzzdcmAePCQ8LbKTS5qgqxHDNUB3pKg==";
        public static string AzureAdPrincipalSecret = "1rnBak-hX]c@YeFO?4c9zsdaBGtzKyq2";
    }
}
Another file, which is a PowerShell script, is named cogninews-encodesecrets.ps1:
$AzureKeyVaultClientSecret = "dummy-for-unittest"
$AzureKeyVaultClientSecretBytes = [System.Text.Encoding]::Unicode.GetBytes($AzureKeyVaultClientSecret)
$AzureKeyVaultClientSecretEncoded =[Convert]::ToBase64String($AzureKeyVaultClientSecretBytes)
Write-Host "AzureKeyVaultClientSecret == " $AzureKeyVaultClientSecretEncoded
In addition to these files that we know might be a bad idea, we’ll see what these pack of tools can find on a our repositories. Let’s get started.
1. Install the Microsoft Security Code Analysis extension in Azure DevOps
Installation is easy. There’s clear instructions from the Microsoft website.
Find the “Microsoft Security Code Anlaysis” extension and ensure you install it. Read about on-boarding and how you can get this in your own DevOps organization.
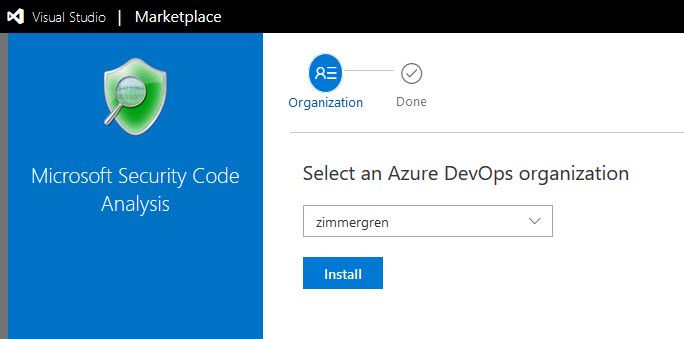
Install the Microsoft Security Code Analysis extension for your Azure DevOps organization.
In the list of installed extensions, you should see it if it’s installed properly:
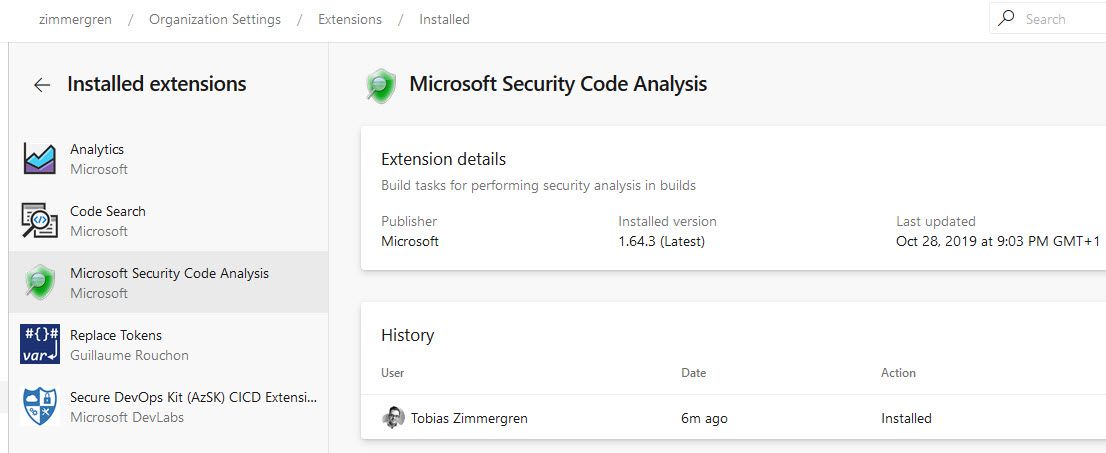
View the installed Microsoft Security Code Analysis extension from the Azure DevOps organization.
2. Set up build tasks
Setting up the various build tasks is easy, and you can read about that more here.
This is my configuration.
Update 2020: The Microsoft Security Risk Detection was deprecated in June 2020, and is not part of this configuration anymore.
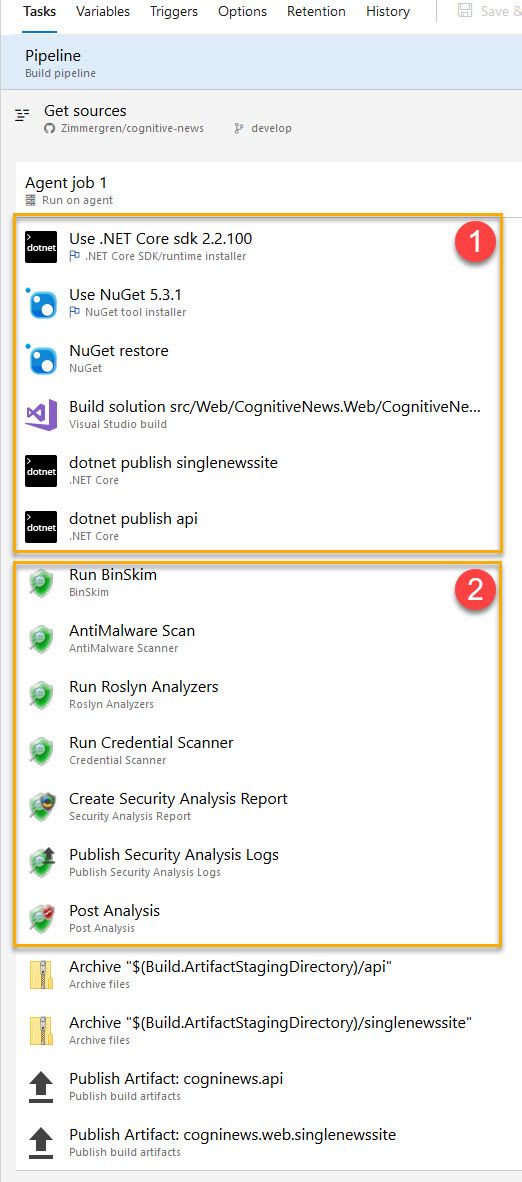
Azure DevOps with the Microsoft Security Code Analysis extension build tasks configured.
In the picture:
- Build the solution and dotnet publish the artifacts (dll’s), so the binaries are built and prepared before we run the binary analysis (BinSkim) later.
- Run our security-related build tasks as you see fit, and then the “Post Analysis” step looks through all the logs and fails the build if there are any issues.
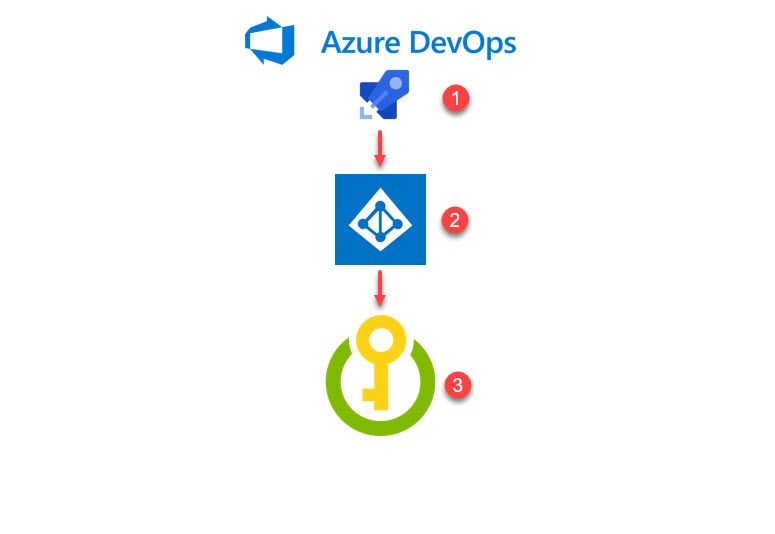
Publish Logs, Security Reports and trigger Post-Analysis tasks
By default, the build will not break even if the build tasks encounter issues. This is by design, as the tasks themselves complete successfully even if they report security issues. Usually this behavior is designed because it allows all tools to run, even if the first tool find some vulnerabilities or issues, which gives you a more comprehensible report in the end. The alternative would be to immediately fail the build, then you fix one error, build again and then discover the next one. Instead, this way you’ll get a list of all currently identified issues and can mitigate them for your next build and then re-analyze.
With this design in mind, there’s of course ways to ensure we can force-break our build if there has been issues in the executions of these tasks. Microsoft provides us with the additional build tasks for analysis and post-processing our results. These tasks are:
- Publish Security Analysis Logs
- Security Report
- Post-Analysis
Let’s take a look at how I’ve configured them in one of my projects, to visualize how I make use of these built-in tasks to digest the logs, get the summary report and eventually fail the build if there’s any issues when I executed one of the security analysis tools.
Publish Security Analysis Logs build task
With this task we can save the log files of our security scan, and push them to where we want them. Usually I leave them as artifacts associated with that specific build, so when a given build has security issues to report, I can view the logs directly associated.
You can also publish these logs to other locations at your discretion.
Security Report build task
Automate the summary of your analysis and configure what level of granularity you want to have reported. This task parses the log files for you, so you don’t have to drill-down line by line.
Post-Analysis build task
This is where I fail my build if any issues have been found in the previous build tasks that relates to security.
Exploration: Investigate what happened
When a build fails, you can review the output and artifacts. Here’s an example of a failed build:
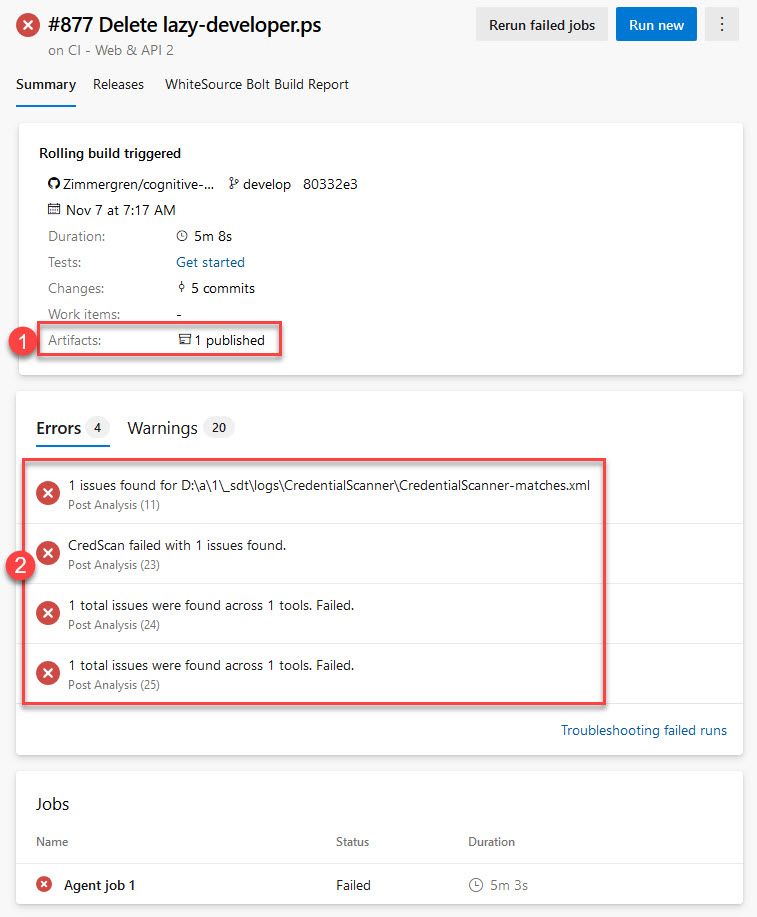
Azure DevOps failing a build because it contains security details or sensitive data in the source code.
In the picture, there is:
- The published artifacts. The artifacts contain “CodeAnlaysisLogs” which I’ll show further down.
- A list of identified errors from the job, and you can click to drill directly into the log of the agent job.
For instance, the below are some log entries for the issues it found in my example code repository.
Success number 1: It found my .pem files:
##[error]3 issues found for D:\a\1\_sdt\logs\CredentialScanner\CredentialScanner-matches.xml
src\core\Zimmergren.Cryptos.Web\public-encrypt\rsa_privkey_encrypted.pem(1,): error : SecretinFile :
{{Searcher}}PemFile
{{Code}}See rsa_privkey_encrypted.pem line 1 for the code resulting in match
{{Info}}Found PEM certificate file with private key.
{{Suggest}}Validate, rotate and remove the secret file, use a secured secret store to save credentials.
Success number 2: It found my PowerShell script’s sensitive credentials:
kubeconfig\cogninews-encodesecrets.ps1(6,): error : SecretinFile :
{{Searcher}}GeneralPassword
{{Code}}See cogninews-encodesecrets.ps1 line 6 for the code resulting in match
{{Info}}Found potential password in script file.
{{Suggest}}Validate, rotate and remove the secrets in file, use a secured secret store to save credentials.
Success number 3: It found my C# code’s sensitive credentials:
src\lazy-consts.cs(7,): error : SecretinFile :
{{Searcher}}CodeConnString
{{Code}}See lazy-consts.cs line 7 for the code resulting in match
{{Info}}Found storage credential in source code file.
{{Suggest}}Validate, rotate and remove the secrets in file, use a secured secret store to save credentials.

src\lazy-consts.cs(8,): error : SecretinFile :
{{Searcher}}CodeConnString
{{Code}}See lazy-consts.cs line 8 for the code resulting in match
{{Info}}Found storage credential in source code file.
{{Suggest}}Validate, rotate and remove the secrets in file, use a secured secret store to save credentials.
Sensitive data like this should preferably be looped in with Variable Groups liked to Key Vaults, for example.
CodeAnalysisLogs artifacts - what’s being produced for us?
Previously I mentioned that you could click “artifacts” and then browse all the available artifacts from the failed build. With the Microsoft Security Code Analysis extension, these are available out of the box by just ticking what reports you want in the build tasks.
Here’s my current reports from the example project:
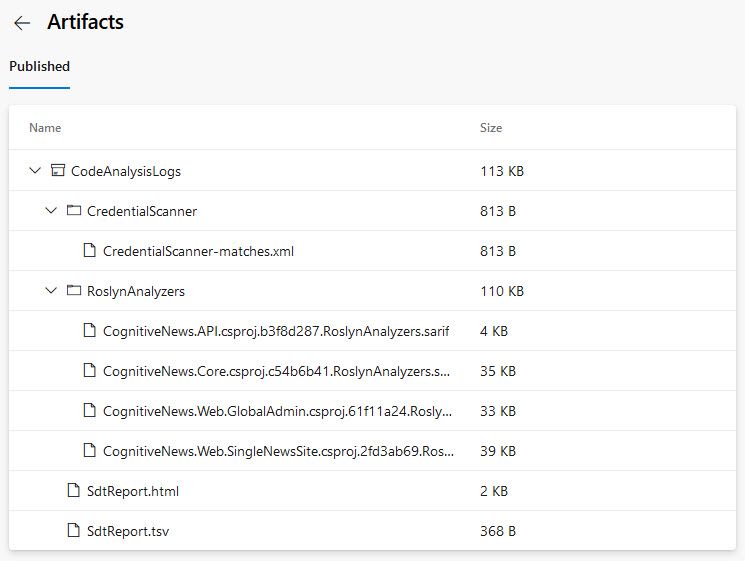
Microsoft Security Code Analysis extension artifact output from a failed build.
From here you can now investigate and drill down into every single piece of information that has been flagged as a warning or error, and get a simplified troubleshooting experience.
A tip: Check out the StdReport.html which contains a simple HTML page, where you can click and drill down into the various issues it has discovered.
Summary & Links
If you want to dwell deeper into the related tech and resources of what we’ve talked about in this post, here’s a list of useful links and resources. Have at it!
- About Microsoft Security Code Analysis (Microsoft Docs)
- Microsoft Security Code Analysis Website (Microsoft)
- Install the Microsoft Security Code Analysis extension (Microsoft Docs)
- Microsoft Security Code Analysis FAQ (Microsoft Docs)


Comments are closed