In recent years I’ve spent all my time planning, designing solution architecture and building cloud solutions and systems in and around the Microsoft Azure ecosystem.
During the development of Functions at scale, processing billions of entities and hundreds of millions of queue items per month, it wasn’t unexpected to bump into some issues along the road.
In this short post I’m mentioning some basic thoughts and tips around Azure Function development, and what could be worth thinking of.
Problem: Scheduled triggers that don’t trigger
When I have a lot of Functions running, and I need to ensure that they consistently deliver the desired functionality and results, I can implement various checks to ensure they’re behaving - including App Insight logs with “ping” messages to ensure that there’s at least N messages in the last X minutes, else the Function didn’t trigger successfully.
What we’ve noticed is that with Scheduled triggers, they don’t always trigger. This is awkward, and we haven’t found an exact solution or cause yet - not even on the Azure back-end side of the coin with the team.
With that, I’d always recommend putting some measures into place to ensure you properly monitor your systems - but this goes for any type of system, not just Azure Functions.
First up: See the real execution history in the logs
You should always have your Function connected to an Application Insights service for proper troubleshooting, diagnostics and logging. From your Application Insights, you can query the execution log of your Functions, to see the actual execution invocations and not just rely on the Azure Portal UI to tell you what’s what.
In your application insights, go to “Logs (Analytics)” and input this query. Adjust to your own variables and names accordingly.
 requests
| where operation_Name == 'ControlApp' and success == 'True'
| project timestamp, success, resultCode, operation_Id, cloud_RoleName, invocationId=customDimensions['InvocationId']
| order by timestamp desc
Tip: You can remove the “project” and property names to get the entire objects back. It’ll be more expensive queries, but with more details if you need it.
A more detailed and recent (real world production logs) example of this output comes here. This is from a production-running function, running on an hourly schedule. If I didn’t know any better, I’d say it’s working - but with the health ping, I knew there was something going on. Here’s a full detailed execution log from Log Analytics, of the real execution times. It’s supposed to execute on the hour sharp, every hour.
2019-09-13 23:00:11.2918930
2019-09-14 00:00:12.9000800
2019-09-14 01:00:12.4637880
2019-09-14 02:00:12.3607540
2019-09-14 04:00:12.4945780
2019-09-14 06:00:13.6811620
2019-09-14 07:00:13.5528170
2019-09-14 12:00:16.3279970
2019-09-14 14:00:16.6707160
2019-09-14 15:00:17.4980010
2019-09-14 16:00:17.4174210
If you look closely you’ll see that there’s some entries missing:
- 03:00
- 05:00
- 08:00
- 09:00
- 10:00
- 11:00
- 13:00
That’s almost half of the entries just from my given time span. Point in case: Ensure you monitor your systems.
This issue appears to happen intermittently, and in various Regions. I have yet to figure out a pattern for the behavior - the only common denominator is that it happens, and it will happen again. Today, or next week or the coming month.
Until we can figure out what’s going on, we’re better off ensuring a proper monitoring around the systems we put to work for us.
In the next section I’m demonstrating a good way to send health pings from your functions (or containers, other apps…) and then create alerts for them, to ensure you get the expected executions - if you don’t you’ll be notified.
So, next up - let’s monitor our Azure Functions execution schedule
I’ll show two monitoring examples below.
- Option 1: Custom alerts based on queries derived from the above data.
- Option 2: Custom App Insight events from your applications, then custom alerts on that.
In each section I’ll talk about the main differences and why I think Option 2 is my favorite for a more reliable monitoring experience.
Monitoring Option 1: Custom alerts based on default request logs
We’ll take a look at how we can use the built-in request logs to set up monitoring with Application Insights. We don’t just measure that any endpoint exist (e.g. not a “is this site alive” check), but we actually check the invocation list as per my above sample query.
The idea is that we’ll keep an eye out for each invocation of the Function and the resulting success code. If it’s a success, our query returns one or more values - if there’s no invocation in the given time period, we have a failure in the actual invocation of the Function. Hence, the schedule has failed to trigger.
Benefits:
- Can be done without modifying any code.
- Can leverage all built-in tooling of Application Insights and Azure Monitor, etc.
In Application Insights, select “Alerts” and create a new Alert. Ensure the scope is set to the Application Insights you’re targeting, and then create a new Condition.
The condition should be a “Custom log search” which you can then define your own search queries to suit your needs. Here’s what my query looks like to identify a specific application’s health ping:
requests
    | where operation_Name == 'ControlApp'
    | project timestamp, id, operation_Name, success, resultCode, duration, operation_Id, cloud_RoleName
    | order by timestamp desc
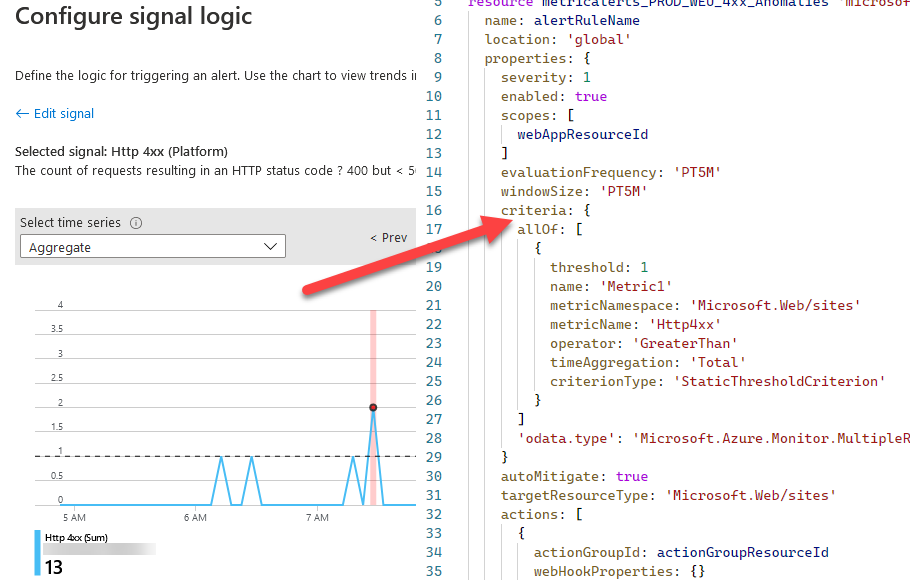
My “ControlApp”, which is a type of manager application for other resources, needs to run at least once per hour. If it runs more often, that’s not an issue - but if it runs less often, it becomes an issue with reliability and availability and outdated data. Here’s the UI in the portal when configuring the alert:
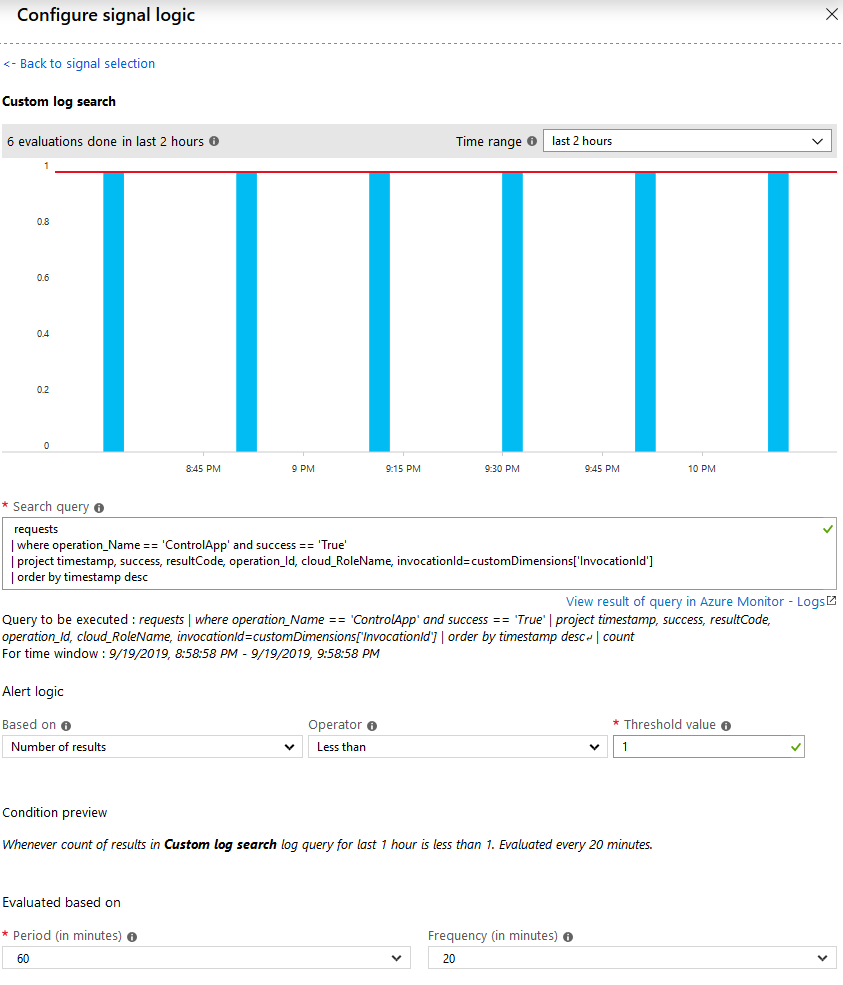
Configure a custom Alert for Application Insights logs search based on the built-in invocations of a Function.
To summarize, we’re doing this:
- Define what to look for with the query.
- Evaluate that there’s been at least 1 entry, every 60 minutes.
- Ensure that that evaluation happens every 20 minutes, rolling.
- If there hasn’t been any invocation, the alert is triggered.
That’s it for Option 1. We have now created a reliable way to measure that the scheduled application is actually running without any intermittent issues - and if/when any issues happen, we’ll be notified about it on the cadence we set in the conditions above.
Monitoring Option 2: Send a ping to App Insights every N minutes
First thing: There’s various measures to implement a similar pattern - I like this one because it’s based on the code base and will work in your containers, functions, web jobs, etc - and work whether they’re hosted in Azure, on-prem, or a different cloud system altogether. That’s why I’m going down that route for my systems. I have already migrated workloads back and forth between ACI’s and Functions, and this makes that entirely seamless. With the following option, we don’t check the invocation log of the Azure Function, but instead listen for a health ping from the code that is supposed to run from the Function, enabling it to run anywhere and still ensure we get a health ping.
One thing I’ve done both from my container solutions and from my Functions alike, is to send a “ping” message from my code once it kicks off. This allows me to without a doubt know whether my actual logic were processed or not.
With Application Insights, we can then configure an alert to check for custom events, similar to checking for invocations in the previous section.
The rule will ensure that at any given point, there’s been a “ping” message sent to the logs in the cadence we expect (at least 1 ping in the last 60 minutes, for example). If it hasn’t, it means the code was not executed, or something was faulty during execution. Hence, a good time to trigger an alert.
To do this, we’ll do the following things now:
- Rig our code (C# .NET Core) to send a health ping
- Verify the custom event is visible in App Insights
- Define a new alert based on a custom log search
Tag along.
Code sample: Sending a basic “Ping” to App Insights
I’m coding in C#, so bear with me if you’re using something else. The logic remains the same for all other steps.
I have simplified this code a bit for the purpose of this post, just to show the basic parts (e.g. send the custom event with the ping).
// The below variables are configured from other parts of my code
string appName = config.GetAppName();
string instrumentationKey = config.GetValue("appinsights:instrumentationkey");

var eventName = $"{appName}-ping";

TelemetryConfiguration.Active.InstrumentationKey = instrumentationKey;
TelemetryConfiguration.Active.TelemetryChannel = new InMemoryChannel { SendingInterval = TimeSpan.FromSeconds(3) };

TelemetryClient _telemetryClient = new TelemetryClient();
telemetryClient.Context.Session.Id = SessionId;

telemetryClient.TrackEvent(new EventTelemetry(eventName)
{
    Name = eventName // sends "myApplicationName-ping" to the app insights custom event logs.
});

this.Flush();
With this code, I’m telling Application Insights that the code was wired up successfully and has started processing. You can decide if you want a pre-logic ping or as post-logic ping. In other words, decide if you want to send a ping before the rest of the code logic executes, or if you want to send the ping once the full logic has completed execution. I’ll leave that up to you and your scenarios - both are valid for various purposes.
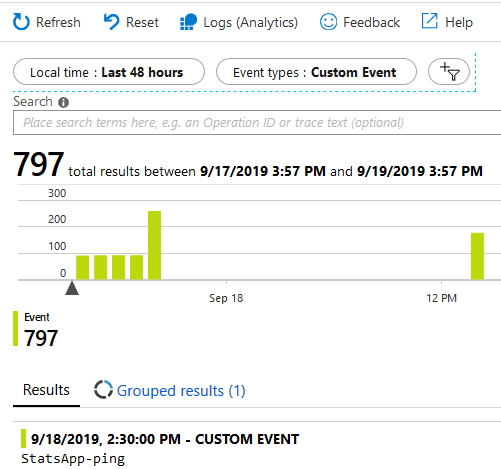
Review Application Insights for your Custom Event
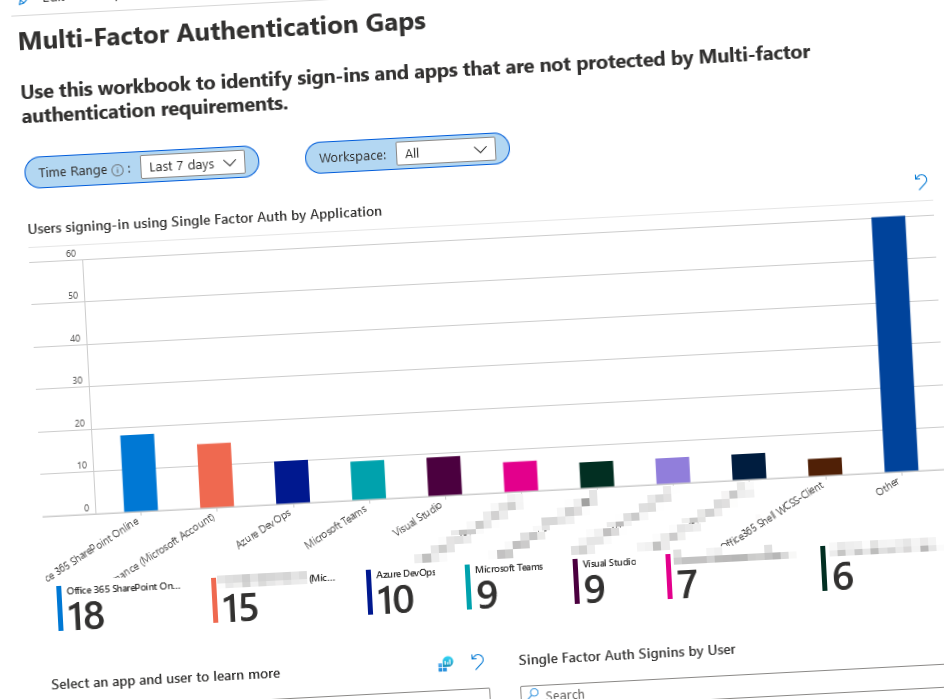
In App Insight, there should be a message called “myApplicationName-ping”, if that’s the name of your application. Something like this:
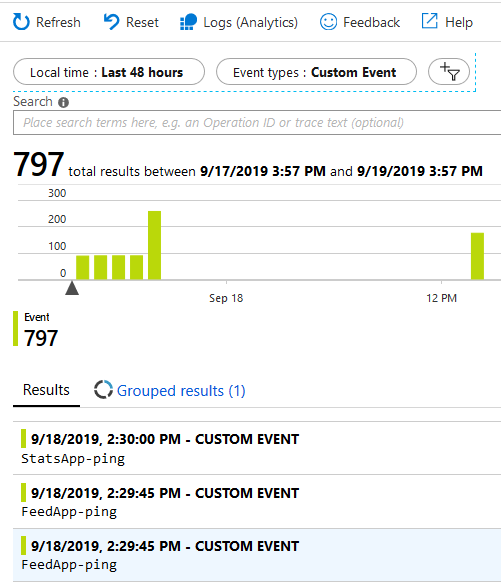
Application Insights custom events for Azure Functions “keep alive” ping.
In the examlple above, my alert was triggered because there was a downtime of the function. A deliberate downtime this time due to firewall configurations and data migrations, so I could disable the alerts during that period - but you get the point.
Create an Application Insights Alert for your Custom Event (health ping)
This step should preferably only be done once your function, including the ping-code, is up and running. The reason for that is obviously that you’ll get a lot of alerts from App Insights if you enable this alert rule before you actually have any ping messages, because the system thinks you’ve got downtime.
Like before from Application Insights, go to “Alerts” - new “Condition” - “Custom log search”. For the custom health Ping, my query is simply looking for any customEvent where the name is “Whatever-Ping”, as I told it to send from code:
customEvents
| where name == "YourApp-ping"
The result should be visible in the UI already on this page to verify that things are in order, and if you’ve successfully completed everything, you’re good to go and should see that you’re above the threshold when you input your query:
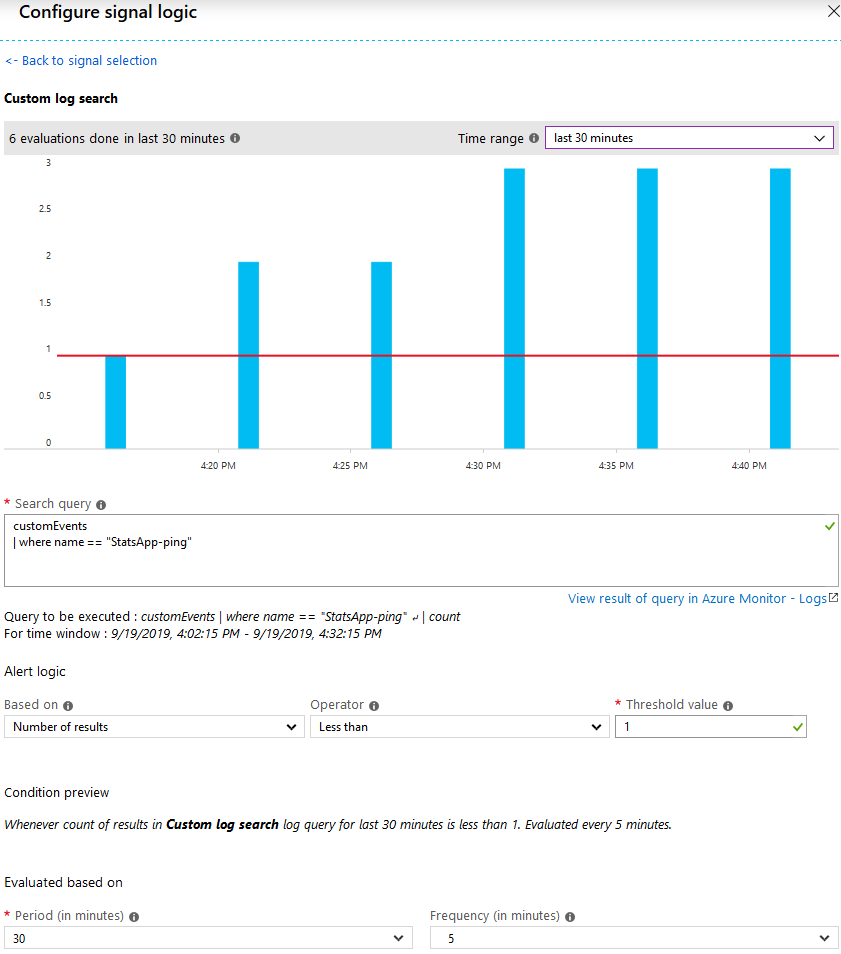
Azure Application Insights looking for “StatsApp” health pings every 5 minutes, ensuring that there’s at least 1 ping every 5 minutes.
In this definition, I’m telling App Insights that:
- Every 5 minutes you should make a check
- The check should ensure that there’s at least 1 ping in the last 30 minutes
- If the number of occurrences is less than 1, we have an issue and an alert is sent
Summary
There we have it. A health probe from our code, out to App Insights and measured and monitored with Alerts.
It’s fairly straight forward, and it can be used in Azure Functions, Azure Kubernetes Services, Azure Container Services, AWS systems, on-premises deployments, and anywhere else you can think of that has an internet-connected infrastructure.
While we haven’t figured out why scheduled triggers don’t always trigger, at least we can monitor this and get back to Azure Support when it happens in order to dive deeper into why it may happen. This is an ongoing journey.
I hope you enjoyed this tip. Please drop a comment, thanks for reading!
Comments are closed