
Launching new websites, services and applications in the cloud is easy. However, the fact that getting something up and running is easy, doesn’t mean that it’s sufficient for an enterprise-grade or distributed-scale application to operate in the long run.
Designing the solution architecture, infrastructure and configuration of your apps and services are extremely important - and if you intend to embrace a real workload (not “see my demo here”), you need to ensure that things are flying at all times, with redundancy and failovers.
In this post we’ll talk a bit about diagnosing and troubleshooting errors and issues with Azure App Services. In future posts we’ll dissect the details a bit more about how we can design a great solution architecture, and then further drill into how we can set up a reliable and redundant infrastructure that is inherently secure all the way from development to infrastructure operations. For now, let’s just drill into the App Service diganostics and troubleshooting options which is a good first step to understand how ready we are for prime time.
Hello, App Service Diagnostics
With the App Service Diagnostics, you get a lot of automated troubleshooting help for your apps. This is great if you’re already running in production, or if you’re about to launch something from dev/staging/pre-production and want to ensure that the configuration and deployments are solid.
You can find the diagnostics directly from your App Service’s “Overview” page:
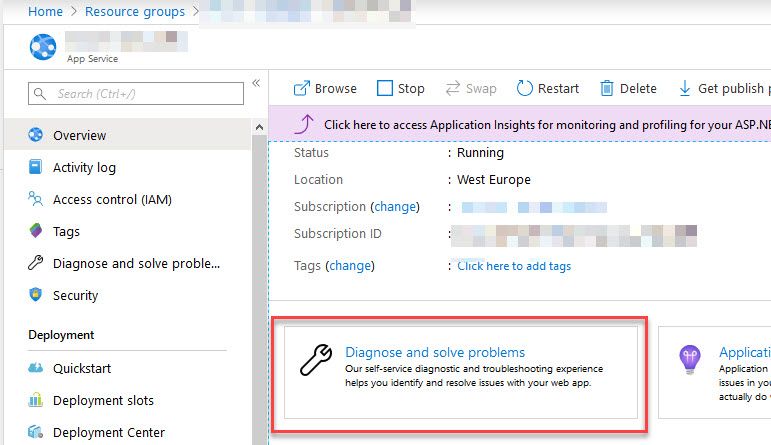
Azure App Service Diagnostics available from the Azure Portal
From the landing page of the diagnostic tool, you will get a set of options to choose from. Here you can determine what you want to investigate further, and then select the one that’s appropriate. These options all offer automated checks for your and help you verify and validate your setup - including diving into logs of availability, performance, configuration of SSL certificates, etc.
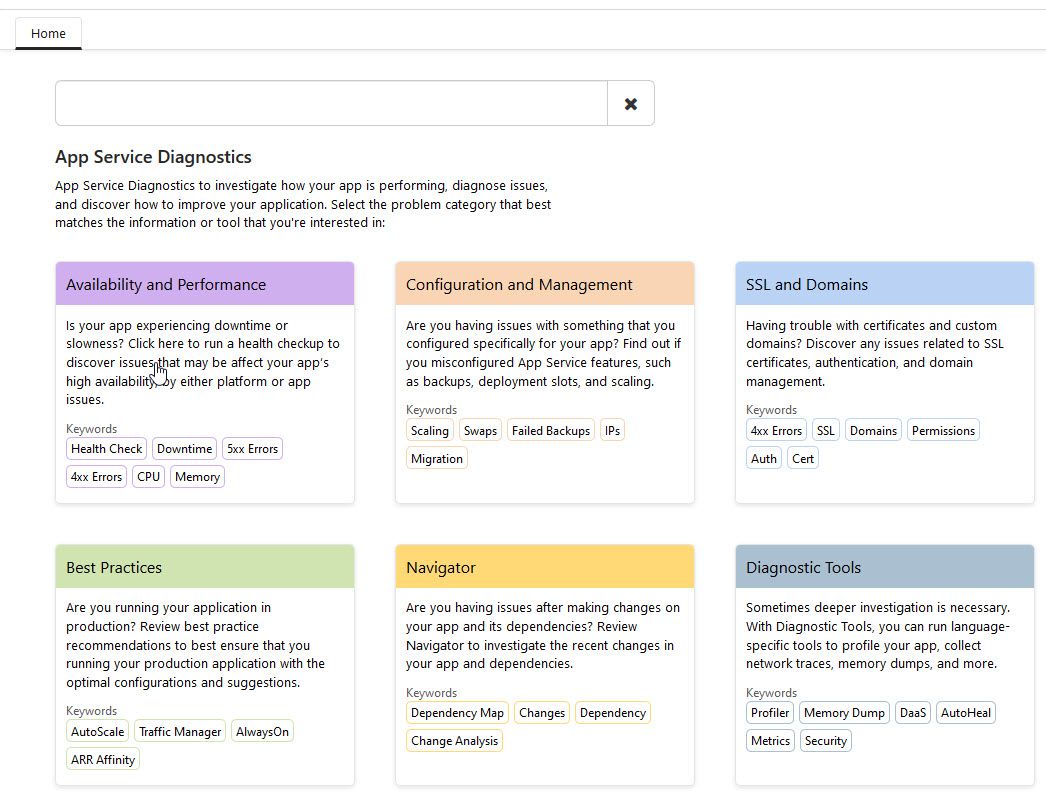
Azure Portal offers the App Service Diganostic options to help find and mitigate issues in your apps
Just by reading this overview selection screen, you realize what a plethora of help options you have. Selecting one of these options will take you to a specific troubleshooting detection process that help you drill down into anything that is, or could be an issue.
Here’s a brief intro to these sections.
Availability and Performance
As the name implies, this section will help you diagnose issues with your app service in regards to availability (uptime, responsiveness, geo-accessibility, etc) and performance.
If there’s underlying issues with the infrastructure or the deployed code, it can look like this, which the diagnostic tool drills down for us automatically.
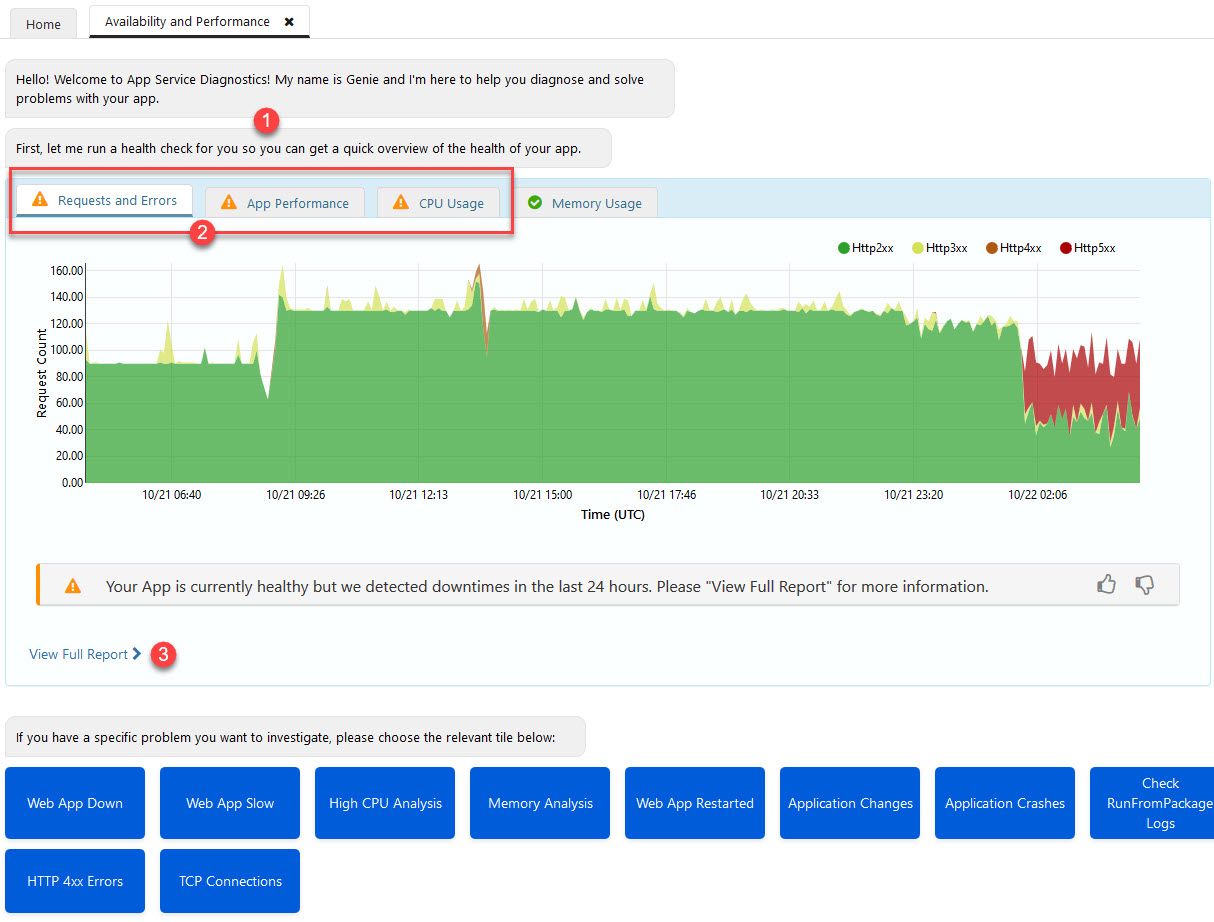
Azure App Service Diagnostic tools for Performance and Availability
In my example above, you’ll find this:
- Azure will let you know that it’s running a check for you, automatically. Thanks!
- If something is flagged, you’ll see a warning icon here and you can drill down.
- To see further details about your issues (if any), you to display the full report.
Remember that this all happened with only a single click to open this view in the browser. Azure is doing the rest for us, so now we can just drill down into the report to try and understand what’s going on.
If you do have issues with availability and the app being down, you can see this in the report, which displays the Platform availability (is Azure up), and your app availability (is your own app up):
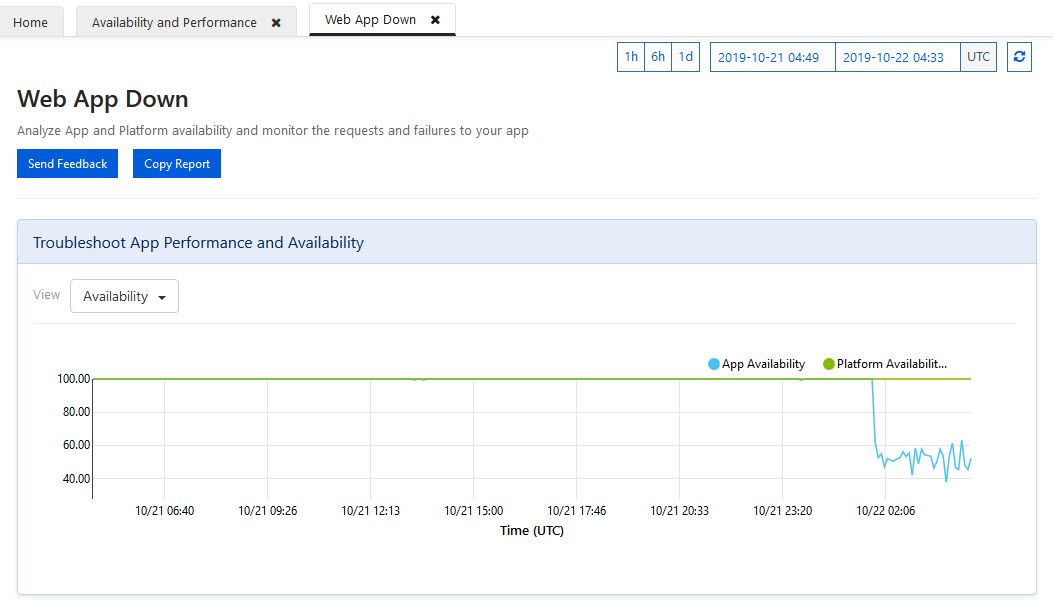
Azure App Service diagnostics and determining whether the app is down or up
In my example, the app took a dive and had a lot of issues with availability, well below 60%. Luckily, that is not in a live production system at that stage - so there’s time to drill down into the issues.
I will refrain from drilling down into the specific issues of this downtime example, as that’s highly depending on your own application and infrastructure.
Moving on with the report, you will get a list of checks that either pass or fail:
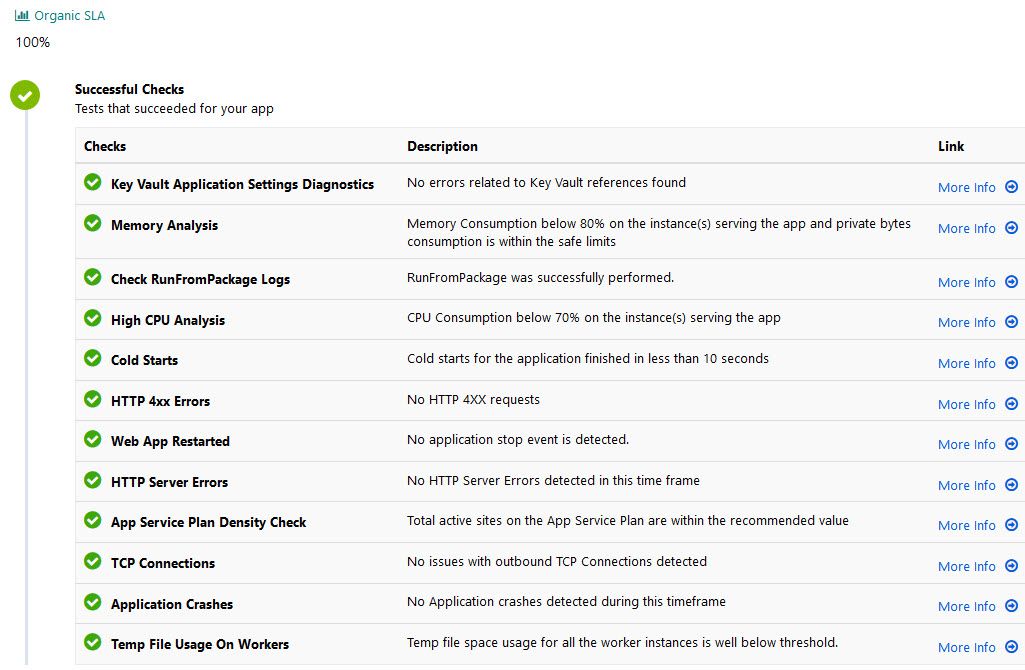
Azure App Service diganostics showing that there’s currently no remaining issues with the web app
If everything is OK, all of these checks should light up green. With my previous example that had downtime, some of these were automatically lit up as warnings or errors, and I could simply drill down with “More info” and Azure made a detection of any issues and expanded further details on what’s causing it.
The availability and performance section helps you determine issues and mitigate downtime - keep your eyes here if uptime is important, and you want to ensure that whatever has been deployed keeps good standards.
Configuration and Management
This option helps you determine if there’s anything you should be aware of related to your configuration. Things like deprecated API’s, IP restriction issues/logs, TLS configuration, etc.
The automated checks under this section are:
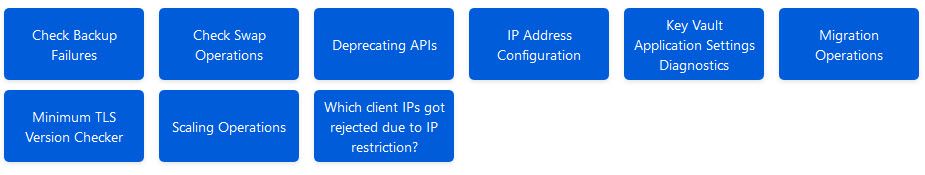
Azure App Service troubleshooting configuration and management, options available
Just click one of the tiles in the menu, and you’ll see the report:
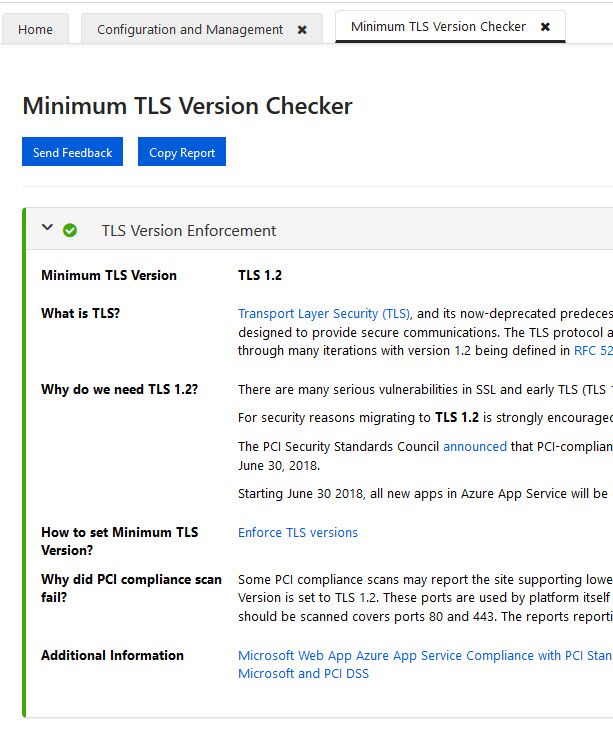
Azure App Service diagnostics and the TLS Version Checker
Nice! You can do this for all the aforementioned options to ensure that everything is configured properly.
SSL and Domains
A common thing that I see are misconfigured domains, SSL and certificate configuration issues. Fear not, this section helps you with that, too.
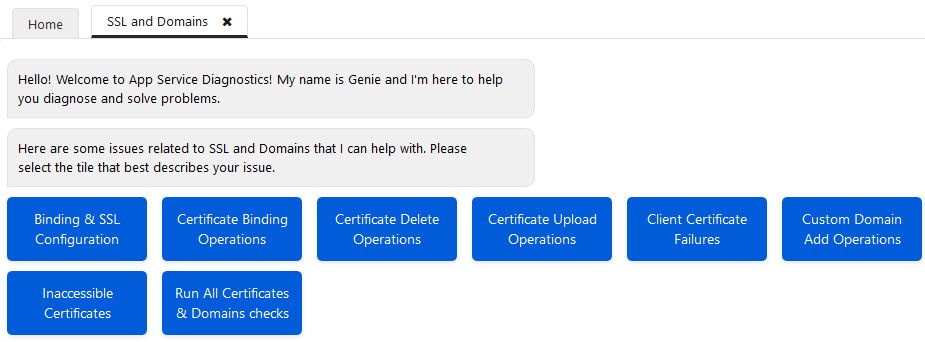
App Service troubleshooting SSL and Domains
Why is it important to check this out? Because of this:
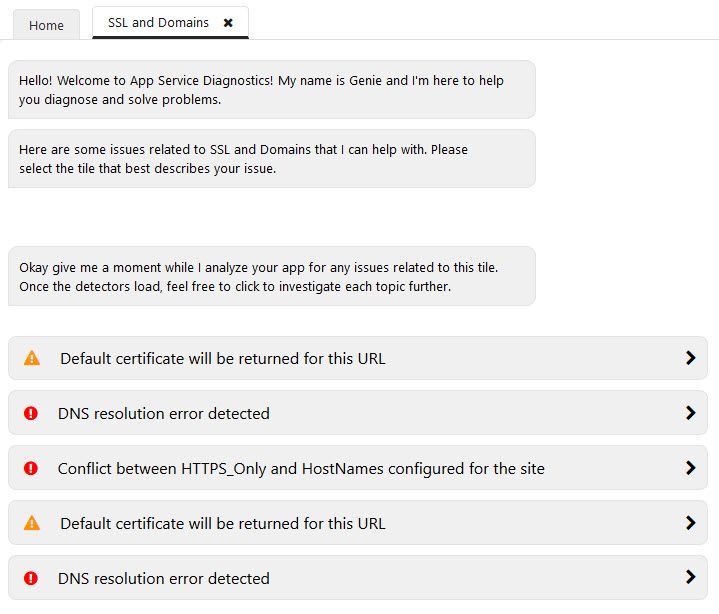
Azure App Service diagnostics showing a plethora of issues with DNS/HTTPS configurations.
In the example above, there’s quite some issues that need to be dealt with. If you’re always on top of your game, you’re already aware of all of these things - but more likely, it’s finding things that’s overlooked or that one is simply not aware of.
Same game as before, select an option for further drill-down and mitigation.
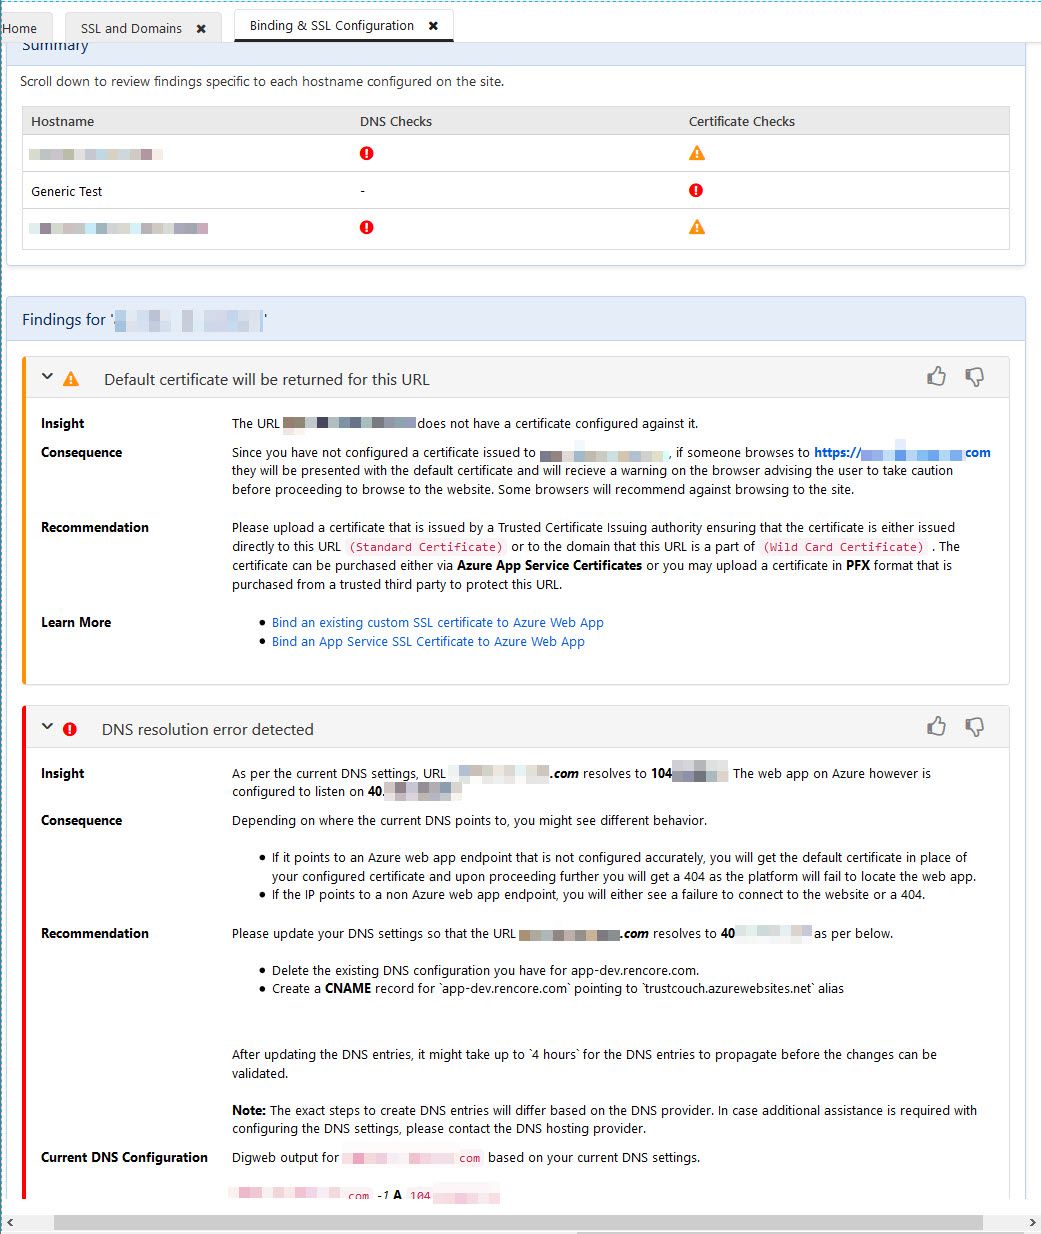
Azure App Service SSL troubleshooting and mitigation using the Azure App Service Diagnostic tools
Slick experience - Azure, again, drills down and finds any issues for us and helps us understand what we need to change. Great!
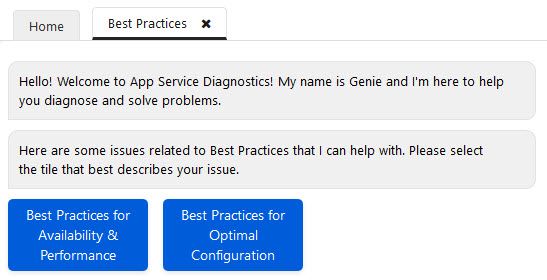
Best Practices
Moving on to the Best Practices section, we get help to determine how well we meet the desired best practice configurations for our app service.
If you’re already running in production, you can also use this to determine if your configuration is solid or needs improvements.
This include the checks here:
Azure App Service best pratices and diagnostics
I’m glad this is only a dev and demo portal I’m using for this blog post, because again there’s quite some things to improve on:
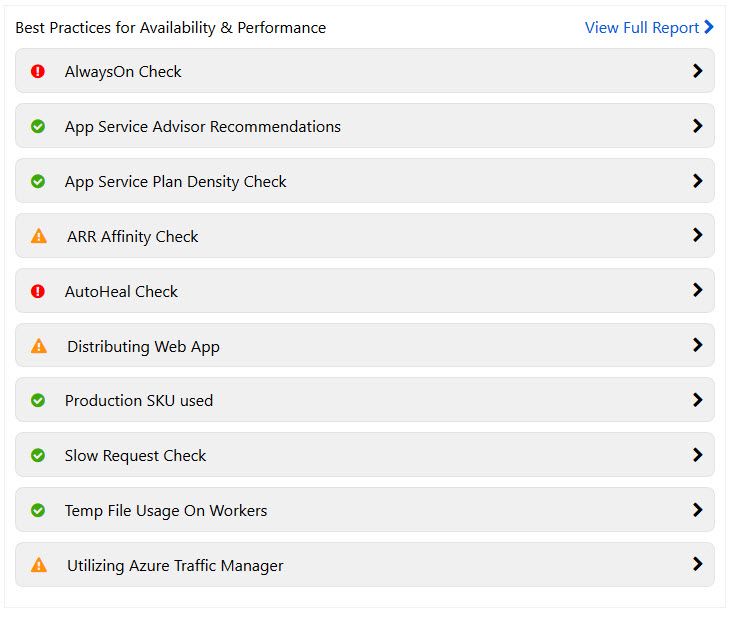
Azure App Service diagnosing Best Practice configurations for our web app
Like previous sections in the tool, you can now drill down into each one of these options, or view the full report to see everything.
It’s a pretty neat guide as you walk through each of these items, and get a check saying whether you’re meeting the expectations of best practices or not.
When you go here and try it out yourself, you’ll know what I’m talking about. This is an amazing help for both production systems and dev setups alike.
Navigator
To use the Navigator, you need to enable “Change Analysis” to investigate the changes made to your web application. This helps us determine if there has been a recent change that has degraded performance, availability or instilled configuration issues etc.
I have no recent changes to show off here, so moving on - but this option is awesome to determine root causes for sudden impacts.
Diagnostic Tools
If the aforementioned sections doesn’t help to determine the root cause of your issues, you can launch deeper diagnostics with the Diagnostic Tools option and run more profiling, language-specific tools, traces, dumps, and all the usual shenanigans for profiling and troubleshooting.
The diagnostic tools comes with these sections:
- Proactive Tools (prevent it from happening/mitigate)
- Diagnostic Tools (it has happened, try to figure out why)
- Support Tools (additional ways to help you understand the issues)
- Premium Tools (security assessments/scans - using Tinfoil Security)
Summary
There we have it. Some useful resources within your App Service to determine the state of your applications.
These things have existed for some time, but I like how powerful they have become and that they’re now such a solid candidate to use for any new app service workload that you’re putting in the cloud.
That’s it for this little tip. Please leave a comment.


Comments are closed