SP 2010: Developing for performance Part 1 - Developer Dashboard
SharePoint 2010 developing for performance article series:
In this series of articles I will briefly introduce you to some key concepts when it comes to developing for performance in our SharePoint 2010 applications.
Related articles in series
- SP 2010: Developing for performance Part 1 - Developer Dashboard
- SP 2010: Developing for performance Part 2 - SPMonitoredScope
- SP 2010: Developing for performance Part 3 - Caching in SharePoint 2010
- SP 2010: Developing for performance Part 4 - Logging
- SP 2010: Developing for performance Part 5 - Disposal patterns and tools
- SP 2010: Developing for performance Part 6 - CSS Sprites
- SP 2010: Developing for performance part 7 - Crunching those scripts
- SP 2010: Developing for performance Part 8 - Control that ViewState
*Part 1 (This article):
*This is Part 1 of 5 where I will introduce you to the developer dashboard in SharePoint 2010. The reason for the developer dashboard being a key concept in your SharePoint development tasks is the quick and effective manner of which you can start looking for bottlenecks and problems in your installation without launching any additional tools.
SharePoint 2010 Developer Dashboard
The developer dashboard is a perfect tool for anyone who wants a quick way to access information about what goes on while rendering a page in SharePoint. It contains information about Web Parts, events, DB calls and a whole lot of nifty information.
Activating the Developer Dashboard
Developer Dashboard is a utility that is available in all SharePoint 2010 versions, and can be enabled in a few different ways:
- PowerShell
- STSADM.exe
- SharePoint Object Model (API’s)
Using these different approaches is very simple; All you will need to do is use one of the aforementioned methods to activate the dashboards, as described here:
Activate the Developer Dashboard using PowerShell:
$devdash =
Microsoft.SharePoint.Administration.SPWebService]::ContentService.DeveloperDashboardSettings;
$devdash.DisplayLevel = ‘OnDemand’;
$devdash.TraceEnabled = $true;
$devdash.Update()
**
Activate the Developer Dashboard using STSADM.EXE
STSADM.EXE -o setproperty -pn developer-dashboard -pv ondemand
Activate the Developer Dashboard using the SharePoint Object Model
using Microsoft.SharePoint.Administration;
SPWebService svc = SPContext.Current.Site.WebApplication.WebService;
svc.DeveloperDashboardSettings.DisplayLevel =
SPDeveloperDashboardLevel.Off;
svc.DeveloperDashboardSettings.Update();
Note that in the preceding samples I’ve used a property called "OnDemand". This can be set to the following values:
- Off (Disables the Developer Dashboard)
- On (Enables the Developer Dashboard)
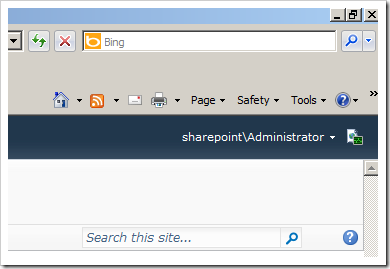
- OnDemand (Enables the Developer Dashboard upon request by clicking the icon in the upper right corner)
If the Developer Dashboard is set to OnDemand, this button appears in the top right corner just next to your login name:
As a side note, you can also enable Tracing for your developer dashboard to enable your dashboard to display the asp.net page trace. I will cover this a bit further down.
Reading the Developer Dashboard information
When you click the small icon in the top right corner, the Developer Dashboard will be opened and displayed at the bottom of your page.
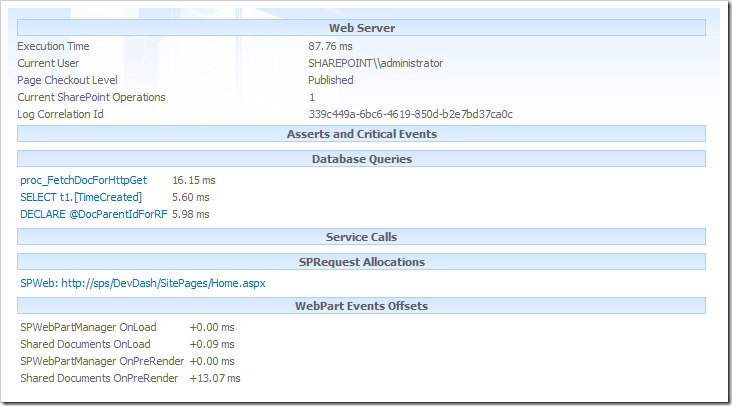
Developer Dashboard example:
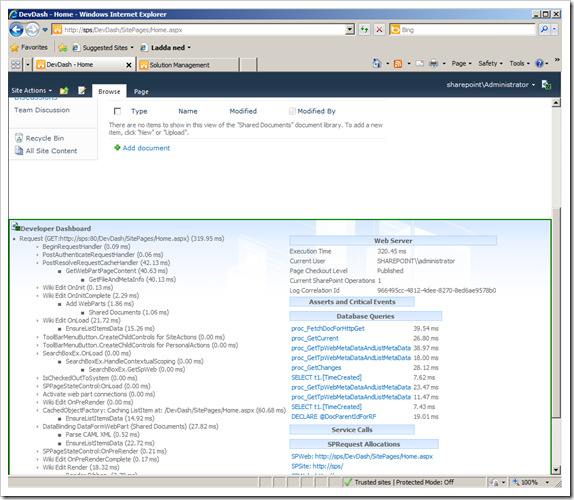
You can see that it has a Green border right now. That generally means it’s loading quick enough not to be a real problem. It can also render Yellow, which indicates that there’s a slight delay and then it could render a Red border which would mean you definitely need to look into it immediately!
So, what information can you read out of this?
Page Request to the left-hand side
You can read out the Page Request, and see what loads and how long it takes to load. This is perfect to use to track down heavy-loading apps or finding out what’s taking so long to render the page;
Web Server, Events, DB Queries, Service Calls, SPRequests, Web Part Events on the right-hand side
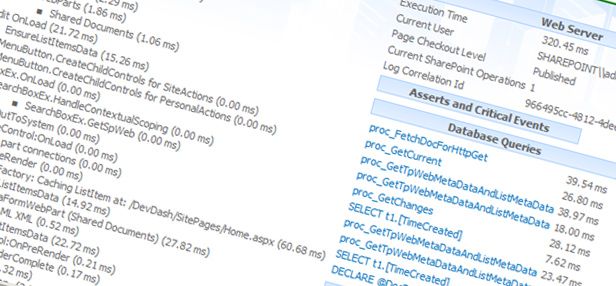
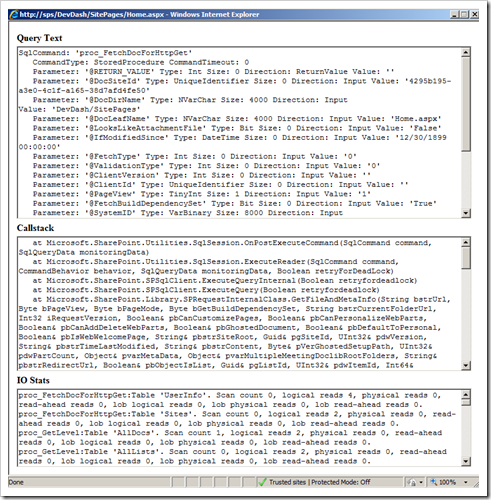
Dig deeper into the SQL DB queries by clicking on the link
If you’d like to get some more in-depth information about what query was shot away to the DB, click the hyperlink corresponding the query you want to find out about and you’ll see something like this;
Displaying ASP.NET Trace information
One thing that I absolutely love about this tool is the ability for the tool to enable Tracing (this should be enabled when you enable the Developer Dashboard using the SP Object Model or PowerShell by setting the following flag:
DeveloperDashboardSettings.TraceEnabled = true;
If you’ve done this, and you’ve got the Developer Dashboard enabled – you should see the following link in the bottom left area of the developer dashboard:
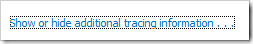
If you click it, you’ll see the full ASP.NET Page Trace like this (awesome, very very awesome):
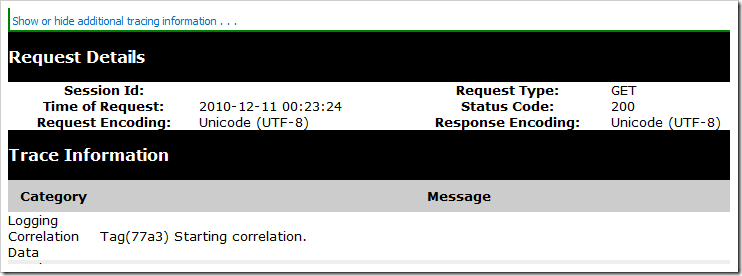
The beauty about this is you don’t have to go and edit the web.config and enable tracing there – you just click this little button and it’s all done. I love it.
Developer Dashboard Visualizer – Extend your developer dashboard with diagrams
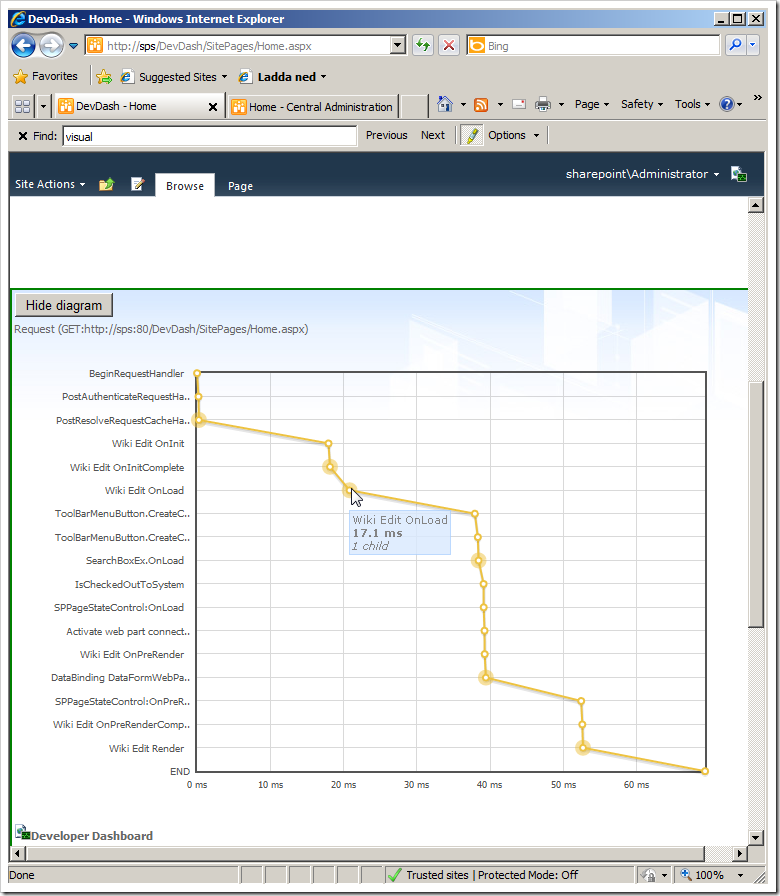
One of my friends Jaap Vossers wrote up a cool functionality to use in conjunction with the Developer Dashboard – Developer Dashboard Visualizer – which is a cool utility if you want to visualize what the rendering process looks like on your page.
If you’ve downloaded this awesome solution, you’ll see a new Site Collection feature that you’ll need to enable:
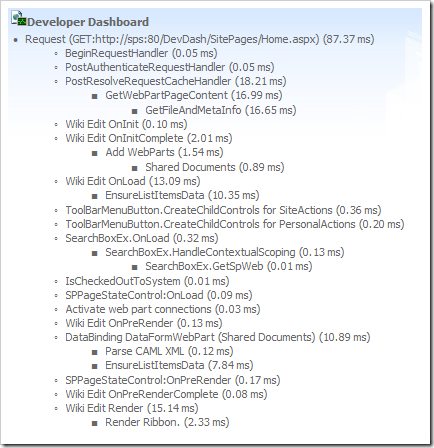
Once that’s done, next time you’ll visit the Developer Dashboard awesomeness it’ll look something like this:
Developer Dashboard activation as a Feature
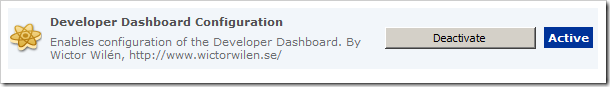
My good friend Wictor Wilén wrote a quick and cool feature to ease the activation of the Developer Dashboard settings (find it here) which allows you to more easily change the settings of the developer dashboard without doing it by typing any scripts or code.
Once you’ve downloaded and installed the solution, you’ll find a new Farm feature that should be activated, which provides some functionality to Central Administration for administering the Dev Dashboard:
If you’ve deployed and got this feature activated, head on over to General Application Settings and you’ll see that you’ve got a new header called "Development Settings" containing a link to "Developer Dashboard Settings".
Click it and you’ll see this very awesome page that enables you to configure the Developer Dashboard without actually writing any code!

Summary
In this article you’ve read about the Developer Dashboard and how to enable it, and a few extra tips that you can download and install to make your experience with the Developer Dashboard even cooler.
This was part 1 in an article series talking about a few concepts we’ll need to understand in order to properly plan and design for performance in our SharePoint 2010 applications.
Stay tunes for parts 2-5.
Enjoy!


Recent comments