SP 2010: Developing for performance Part 2 - SPMonitoredScope
SharePoint 2010 developing for performance article series:
In this series of articles I will briefly introduce you to some key concepts when it comes to developing for performance in our SharePoint 2010 applications.
Related articles in series
- SP 2010: Developing for performance Part 1 - Developer Dashboard
- SP 2010: Developing for performance Part 2 - SPMonitoredScope
- SP 2010: Developing for performance Part 3 - Caching in SharePoint 2010
- SP 2010: Developing for performance Part 4 - Logging
- SP 2010: Developing for performance Part 5 - Disposal patterns and tools
- SP 2010: Developing for performance Part 6 - CSS Sprites
- SP 2010: Developing for performance part 7 - Crunching those scripts
- SP 2010: Developing for performance Part 8 - Control that ViewState
This is part 2.
In this article I will talk briefly about what SPMonitoredScopes are and how you can utilize them in combination with your developer dashboard to get some stats and performance information about your custom applications.
SPMonitoredScope to track performance in your applications
The monitored scope (SPMonitoredScope) is a class you can use to monitor performance and resource usage in your applications by using it in a simple code block.
The pros about using the monitored scopes are of course that you can easily track down and find bottlenecks as well as do some initial performance monitoring while doing your development.
Using SPMonitoredScope
In order to use the SPMonitoredScope you’ll need to add a using statement for Microsoft.SharePoint.Utilities and then wrap your code in a statement like this:
using (new SPMonitoredScope("CallMethod1 Monitored Scope"))
{
    Controls.Add(new Literal
    {
        Text = "Awesomeness"
    });
}
You don’t need to add any more code than this in order for it to be hooked up.
See the results
So what now, what if I’ve added some monitored scopes to some of my classes – where can I see the results?
Answer: Open up your developer dashboard on the page where your code is executing and pow, you’ll see it right there:
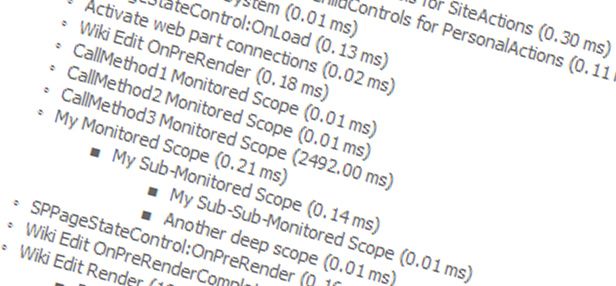
Note: I’ve added three monitored scopes in my code, as seen below named CallMethod1,2,3
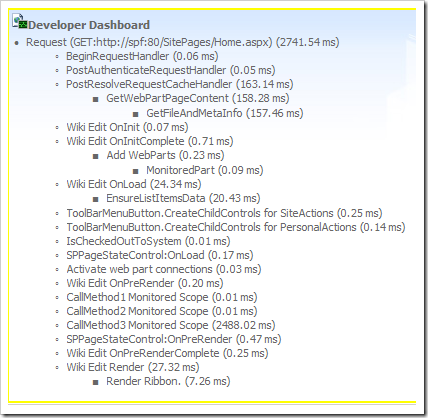
You can see that the CallMethod3 is the one dragging this page down in my particular case. Easy enough to keep track of the request time for your pages!
You can even nest your scopes
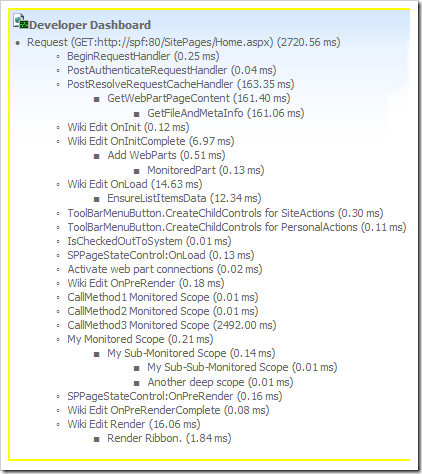
If you’ve got nested method calls and a bit more code (you’re likely to have that), you can of course nest your monitored scopes. There’s nothing to it really, you can instantiate new monitored scopes inside of a monitored scope:
using (new SPMonitoredScope("My Monitored Scope"))
{
    Controls.Add(new Literal { Text = "When the awesomeness is flying… " });
    using (new SPMonitoredScope("My Sub-Monitored Scope"))
    {
        Controls.Add(new Literal { Text = "there’s no stopping it! " });

        using (new SPMonitoredScope("My Sub-Sub-Monitored Scope"))
        {
            Controls.Add(new Literal { Text = "I’m three levels deep!" });
        }

        using (new SPMonitoredScope("Another deep scope"))
        {
            Controls.Add(new Literal { Text = "Rock and rumble, rock and rumble" });
        }
    }
}
Results: Nested scopes (My Monitored Scope)!
Limitations
The SPMonitoredScope is NOT available for Sandboxed solutions unfortunately, so this neat trick will not work if you’re planning on deploying to the sandbox.
Summary
This was a short introduction to the SPMonitoredScope class that you can utilize in SharePoint 2010 when doing custom development. The pros with using these monitored scopes is that you can easily track performance of your custom applications using the Developer Dashboard without even hooking up any debugger or external performance monitor to your servers – this is all done and visualized in the web browser upon displaying the Developer Dashboard.
This is a very easy trick to keep an eye out for performance bottlenecks in your applications for SP 2010.
Enjoy!


Recent comments