
In recent years, I have built and operated distributed cloud systems. With these systems comes various challenges. A key thing I’ve learned is to keep a close eye on metrics and insights, to learn how our applications are behaving at scale.
This post will be about how to make use of Azure Application Insights to learn about performance and execution issues in Azure Functions, and ultimately in Azure App Services.
We will take a look at these things:
- Use cases.
Some favorites from my professional experiences. - Favorite KQL (Kusto Query Language) queries.
Querying the telemetry and logs for insightful data. - Troubleshooting guides.
(Preview) Template-based troubleshooting to find issues in your apps.
Skip to the end to read about this fun capability!
Use cases
I have recently talked about using Azure App Service Diagnostics to improve performance, best practices, security and more. Today, however, we are diving into the fun KQL queries that can be beneficial when trying to discover issues with our Functions and Web Apps.
Granted, the KQL queries can be applied to anything in Log Analytics, including App Insights. Learning this query language will benefit your auditing, logging and monitoring game across all your services in the Azure cloud.
A great capability with Log Analytics and KQL is that we can also paint a visual picture using charts.
Use Case: Get specific operations that performs poorly
Here are two queries. The first one ordered by RequestCount, the other ordered by the AverageDuration. These both are helpful to understand what particular operation are taking longer, on average.
If you want to just see the operations that takes the longest, sort by the AverageDuration. If you want to weigh in how many times it’s running, and see how it performs, use both AverageDuration and RequestCount. You can mix and match a bit with the queries to get the insights you need.
// Get long running operations, order by RequestCount
// Why: Because the more executions you have that have an above-average duration, the more important it might be for you to fix it.
requests
| summarize RequestsCount=sum(itemCount), AverageDuration=avg(duration) by operation_Name
| order by RequestsCount, AverageDuration desc
| limit 10

// Get long running operations, order by AverageDuration, then by RequestCount.
// Why: Get the really bad performing operations first, then filter by execution count.
requests
| summarize RequestsCount=sum(itemCount), AverageDuration=avg(duration) by operation_Name
| order by AverageDuration, operation_Name desc
| limit 10
Here’s the visual and raw output:
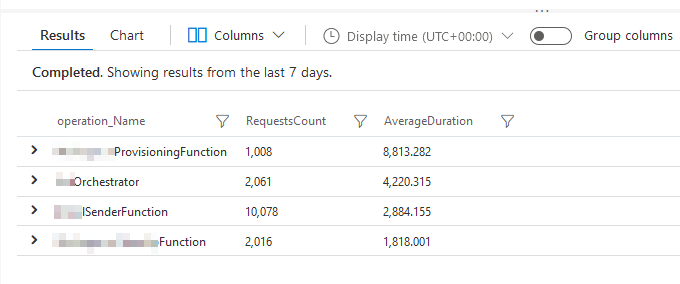
Raw output, by operation name and ordered by average duration.
Viewing the chart helps me understand the average response times versus the relative weight of executions compared to other operations.
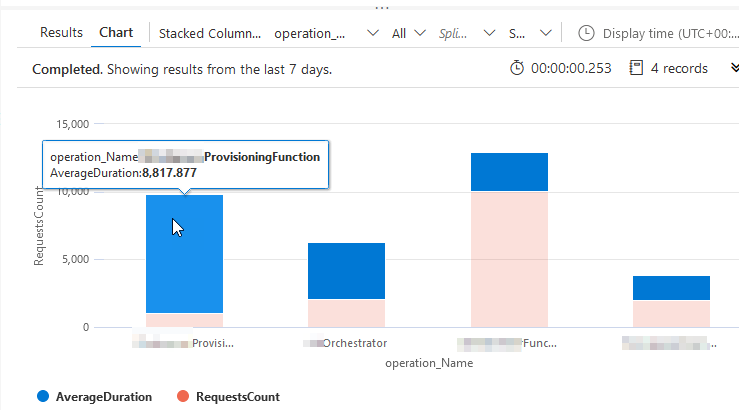
KQL query and visualization, displaying results to understand the average duration of operations, and how many requests have been fired for it.
I can now see the top 10 operations I am executing - visualized by the amount of executions and ordered by the slowest average duration. The first bar shows an obvious performance impact versus the next, which also performs poorly - the rest of the operations are OK.
From this, I can drill down into these two operations and figure out why they are so much slower than the rest.
Success.
Use Case: Some function calls are slow, not necessarily by the same operation
I like to ping the performanceBucket data from App Insights. To paint the picture of what this can look like, I can begin by querying for the given Function App (or all), and any given function, or all.
Here’s how I query a specific function app and a specific function. I know this one is slow sometimes, and I want to see how often we have issues.
requests
| where timestamp > ago(7d)
| where cloud_RoleName =~ 'func-myFunctionApp' and operation_Name =~ 'myOrchestratorApp'
| summarize count() by performanceBucket
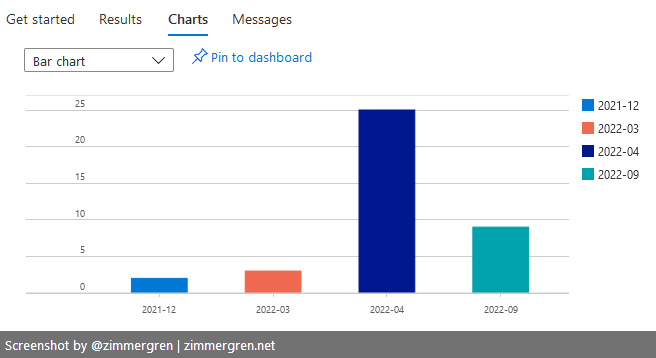
I can see the raw data:
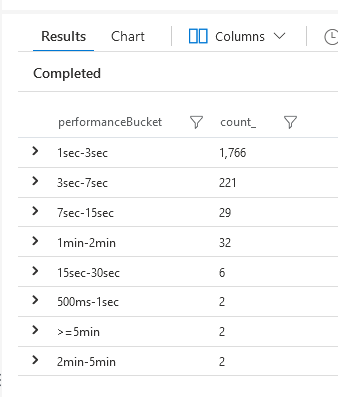
performanceBucket data from Application Insights for my Azure Functions.
I can also see the Chart, to better visualize the spread:
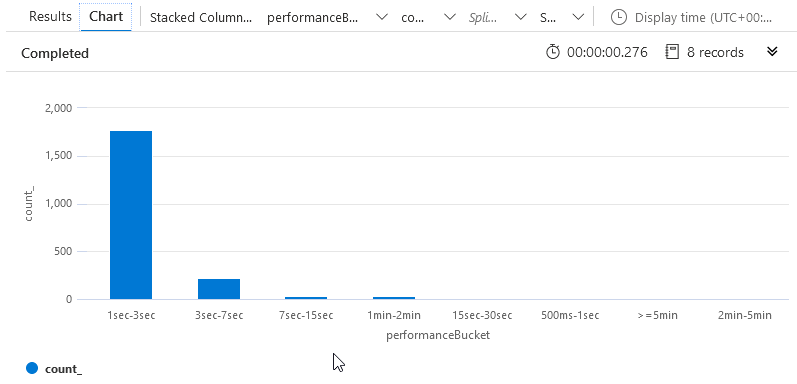
Visualized performanceBucket data for my Azure Functions.
Seeing this data, I can make better decisions on where I need to start troubleshooting. In my given scenario, a 1-3 second execution time is OK, because I crunch a lot of data in that request. However, 3-7 seconds might be on the edge of what I want to allow, and I definitely don’t want any 7+ second executions.
I can now fine-tune my query to grab any executions where the time was more than 7 seconds:
requests
| where timestamp > ago(7d)
| where cloud_RoleName =~ 'func-myFunctionApp' and operation_Name =~ 'myOrchestratorApp'
| where duration > 7000
Then, a neat trick is to tick the “Group columns” feature in the editor:
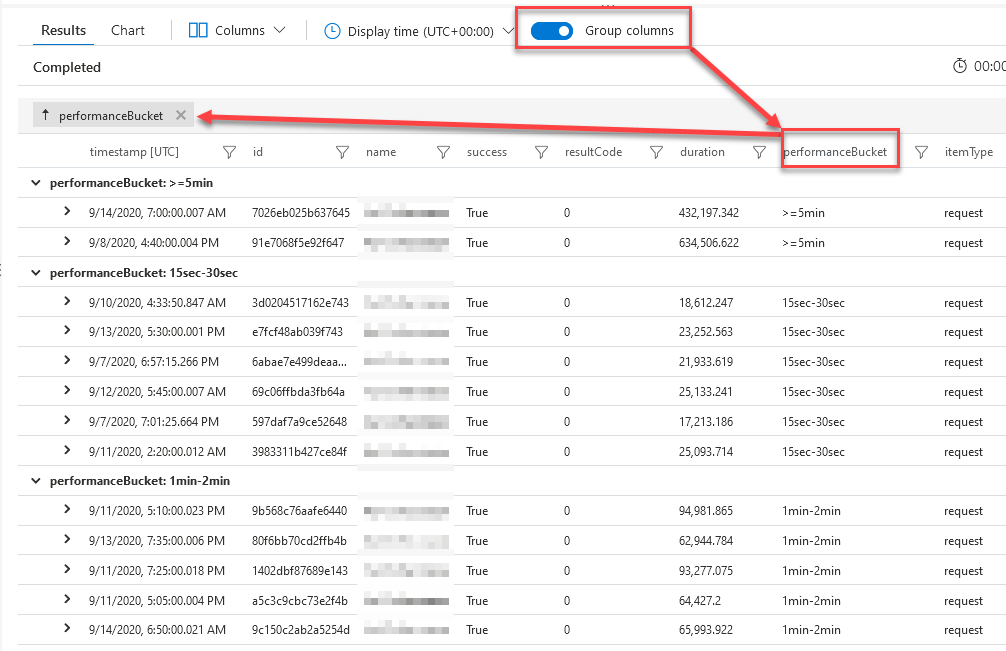
Group columns in Application Insights to get better data from your logs
From here, I can more easily drill down into the specific invocations and try to figure out what happened. Noticeably, I have a couple of executions that takes a really long time for some reason - from here I can now start a better investigation and really drill down into the data.
Use Case: Visualize patterns of unresponsiveness
I really like this capability. With another simple KQL query, we can paint a picture of the average request duration. In the example, it’s set to the last 7 days. Visually seeing an overview like this helps understand and detect response spike patterns. I can see that certain days, there are spikes around noon.
Query:
requests
| where timestamp > ago(7d)
| summarize avgRequestDuration=avg(duration) by bin(timestamp, 10m) // use a time grain of 10 minutes
| render timechart
Results, helping me understand when we may have performance bottlenecks.
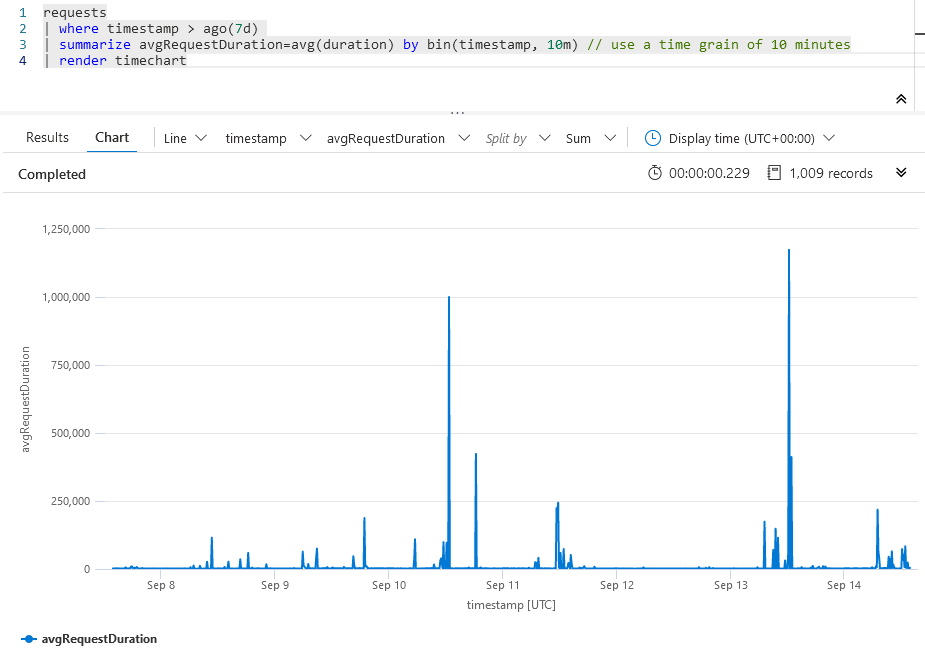
Visualize performance of app services and function apps.
Great. I can see on the horizontal timeline that there are some times of the day, certain days of the week, where the operations are slower than average. These are less-than-ideal spikes, and I want to mitigate them. From this point, I know where to look - and when to enhance diagnostics across the entire system to get more insights, if needed.
Continue to explore your applications
The built-in queries that we get with Application Insights are amazing, too. We can start using any of them, and drill-down and filter as we see fit.
Head over to your Application Insights, click “Queries” and choose from the list of pre-defined popular queries.
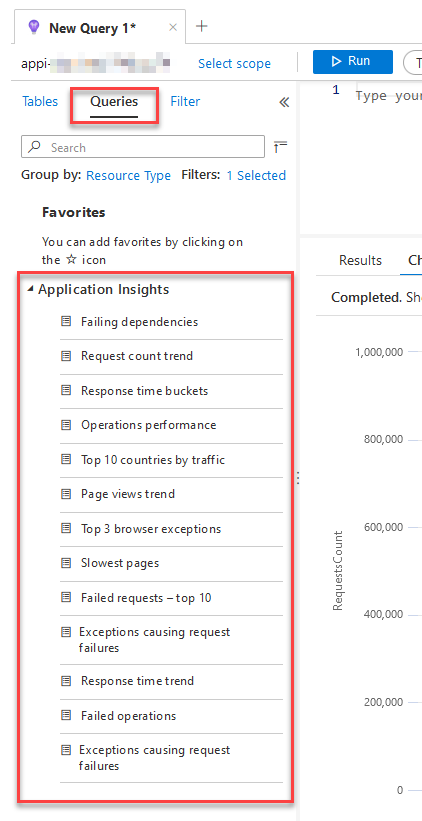
Pre-defined KQL queries in Application Insights.
Click one, and it’ll pop right into your query editor:
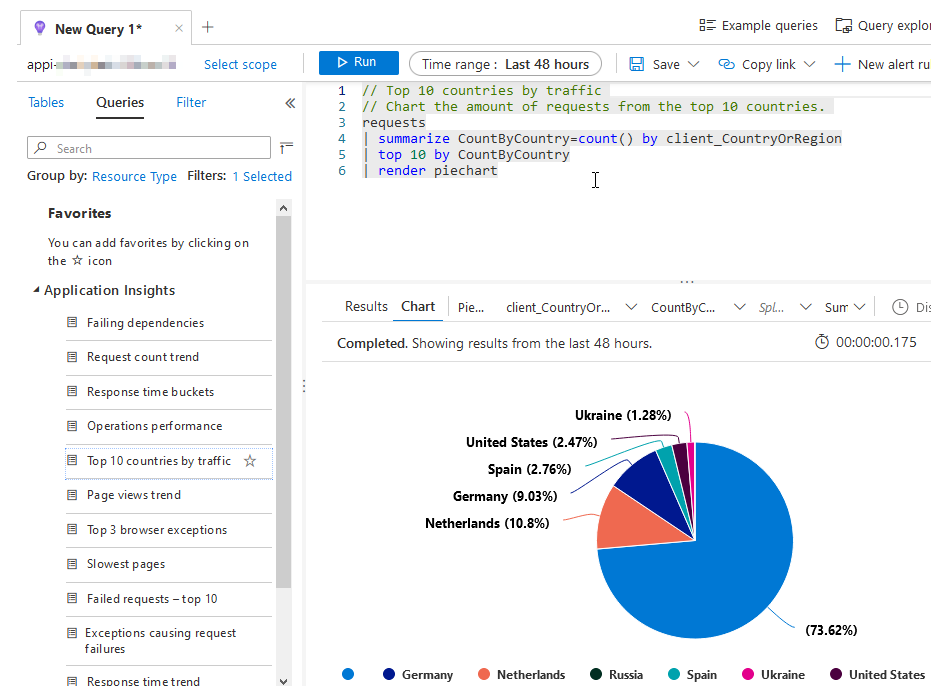
Pre-defined query running in Azure Application Insights query editor with KQL.
Troubleshooting guides
If you try the feature called Troubleshooting guides, you can get a lot of help along the way. Much of the previously manual effort have been automated and put into useful templates for us.
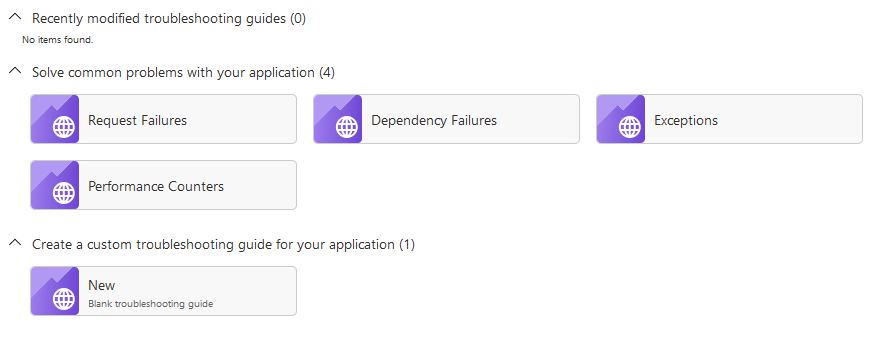
Select a troubleshooting guide in Application Insights.
Here’s the Exception template, ready to be manipulated with a few dropdowns. Immediate insights like this makes it an invaluable tool.
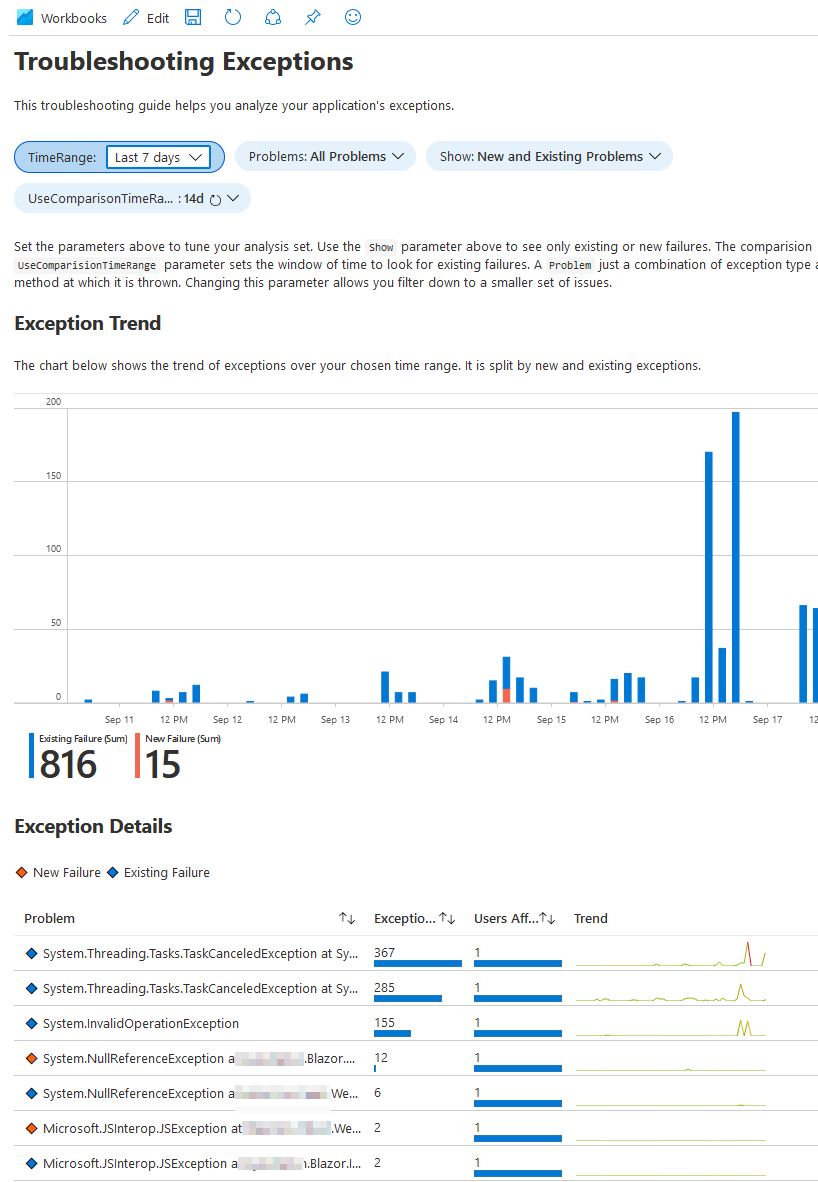
Viewing the Exception template in the troubleshooting gallery for Application insights in the Azure Portal.
Summary and links
Thanks for reading. I hope these tips can prove useful when working with Azure Functions and Azure App Services.
More beneficial links:
- Performance Buckets in Application Insights (Microsoft Docs)
Header photo by Morning Brew on Unsplash
Comments are closed