
I already wrote about “Diagnosing and troubleshooting configuration and application errors in Azure App Services” in October 2019. Today, I am seeing an update to the service and I wanted to bring this new experience to light - it comes with an improved UX, and I really like it.
In my daily work, I deal with production workloads every day. I have built, designed and am operating distributed applications and systems, and some are hosted in Azure App Services.
Sometimes we see performance degradation. In other cases we experience intermittent errors that we can’t easily understand.
Enter Azure App Service Diagnostics.
The available areas to investigate are:
- Availability and Performance
- Configuration and Management
- SSL and Domains
- Best Practices
- Navigator
- Diagnostic Tools
As mentioned in the start of this post, I already talked about this service. It has happened a few things since then, so this post is about the updated experience moving forward - mainly what to expect from the tool, and to shed some light on that it exist and how great this really is.
Using Azure App Service Diagnostic in the Azure Portal
Heading over to your App Service and then “Diagnose and solve problems” will bring you to an overview, with an updated and more modern experience.
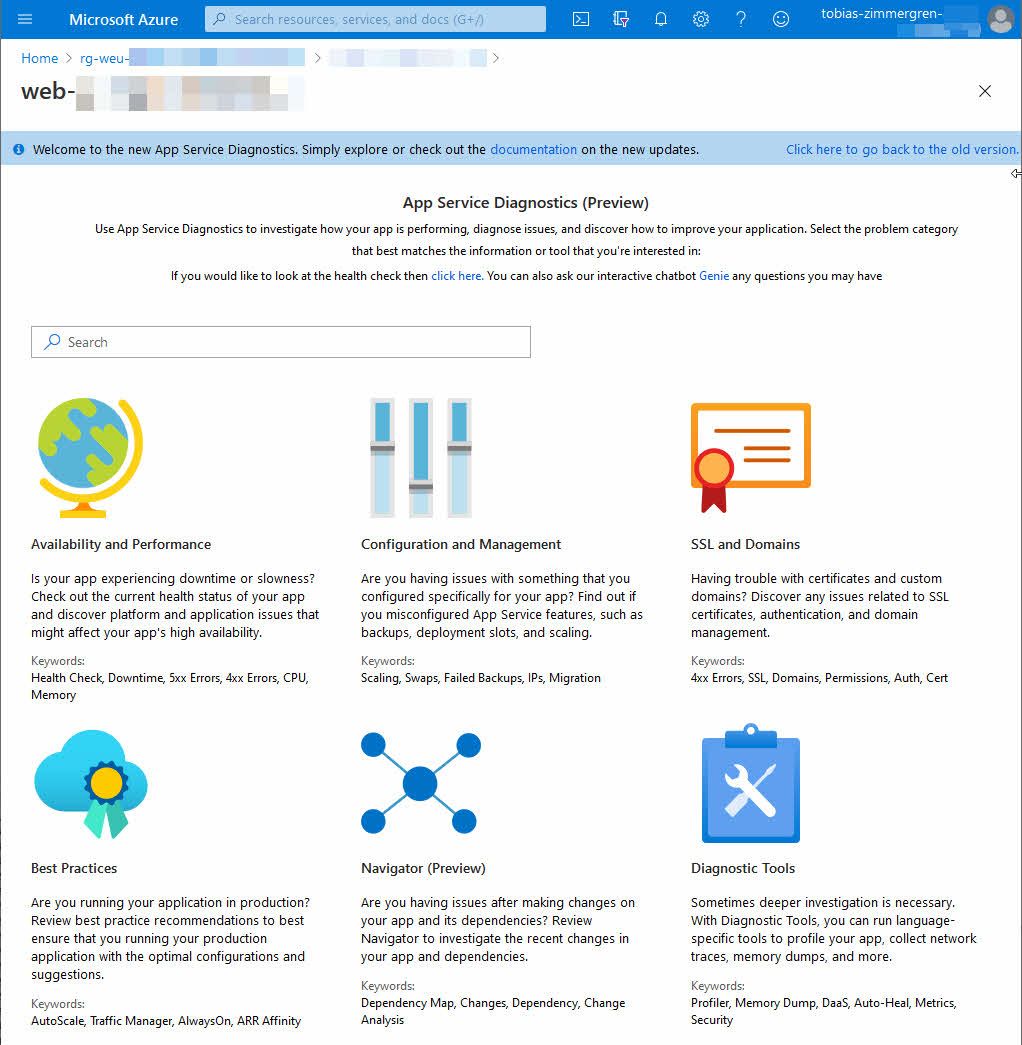
Azure App Service Diagnostics overview in the Azure Portal.
I am not drilling down into each of these checks and areas in detail - the checks change and evolve, and the best things is to go take a look yourself.
I’ll share some of the things I find particularly interesting, and how I think they are beneficial to my current daily work.
Use the chatbot, Genie, to locate areas of improvement
While the older version of the diagnostics tools brought us a “chatbot” experience of sorts, the newer experience is more clear, and seems to be a bit refined - at least the perceived change is good on my end.
You’ll find a button called “Ask Genie”. Use this to kick off your conversation with the troubleshooting bot.
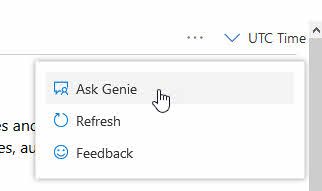
Ask Genie in the Azure App Service Diagnostics tool.
The chatbot, Genie, will fairly quickly answer your question and perform a set of automatic checks if it could identify what you are looking for.
I am telling the bot that “I am experiencing intermittent performance issues”, and within a few seconds it has discovered a few issues with my web app that could be worth looking into:
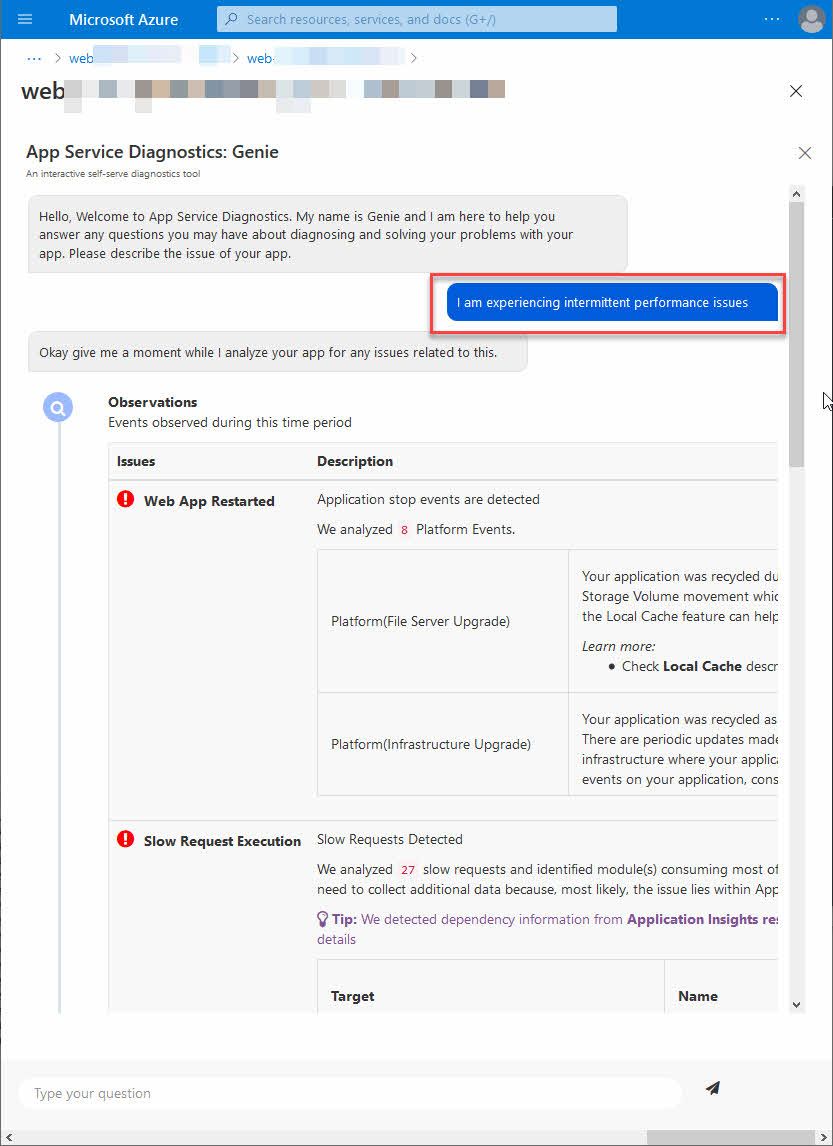
Azure App Service diagnostics, the chatbot Genie presenting recent issues and possible solutions.
Ask Genie is amazing. While “it is just another chatbot”, it helps a lot. You just explain what type of issue you have, and immediately it tries to understand it, and then look for related events and metrics that could be of relevance.
Pro tip: I have used this in production several times, and it works. It is extremely helpful to find issues based on this type of “conversation” with the chatbot. Try it out as soon as you can. Really!
A helpful part of the troubleshooting is to know what is considered OK, as well. Below the potential warnings and errors, you’ll get a list of successful checks where no apparent issues are indicated.
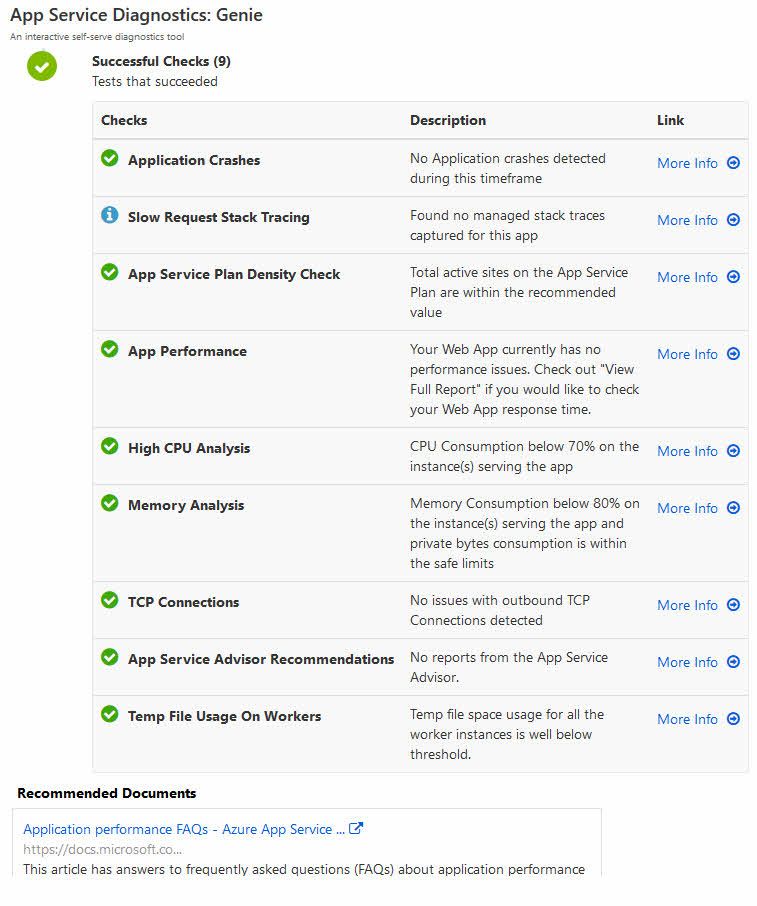
Azure App Service Diagnostics and the chatbot Genie, displaying what checks have been successful.
I like it.
Areas for Diagnostics
As the initial landing page indicated, there’s various areas for diagnosing and troubleshooting your app.
While I will not dive into deep detail about each of them here, it could serve as a beneficial insight to see what these sections offer, in case you ever feel stranded in your troubleshooting experiences.
SSL and Domains
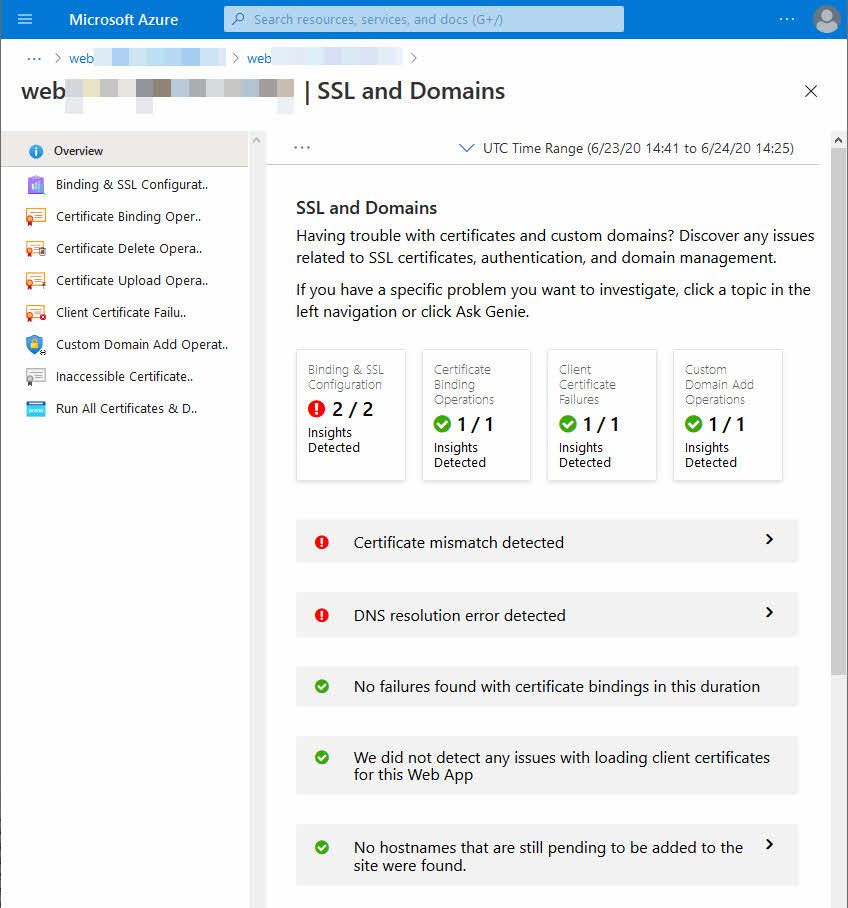
Drilling down helps us understand “why” it is an issue, and how to mitigate the issues.
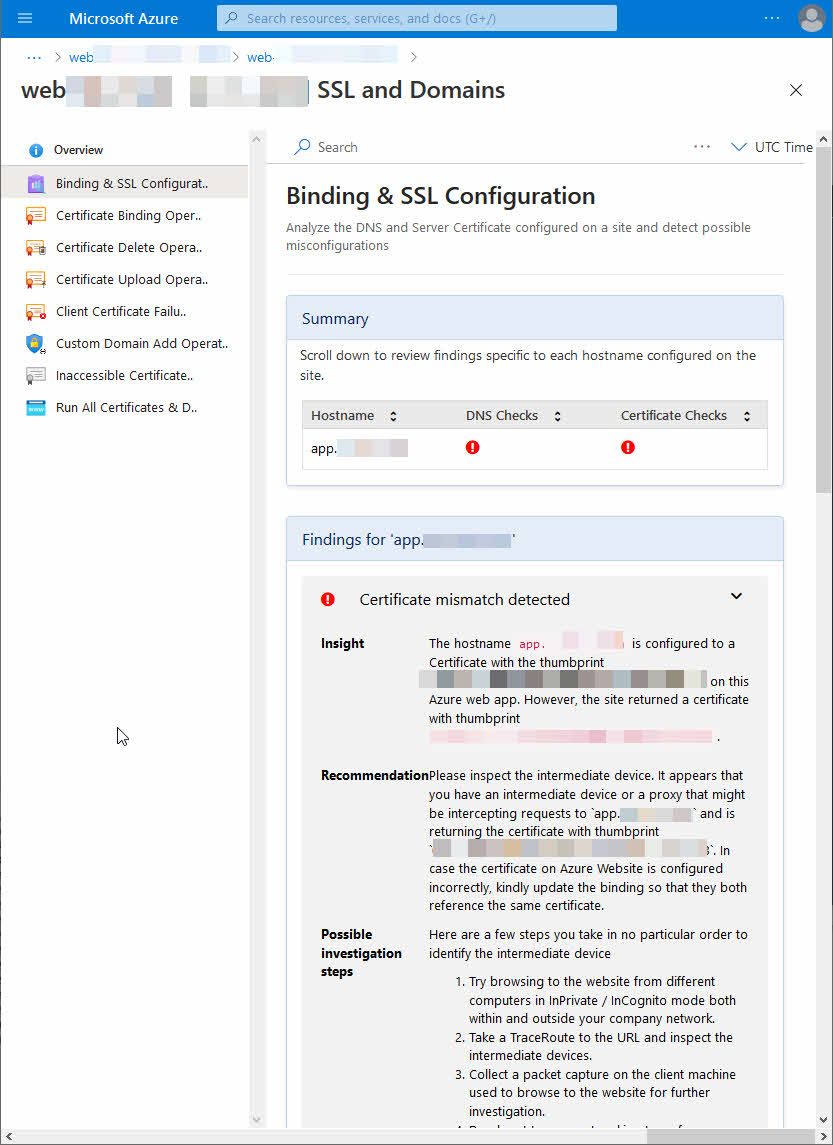
Mitigation steps from the Azure App Service Diagnostics experience.
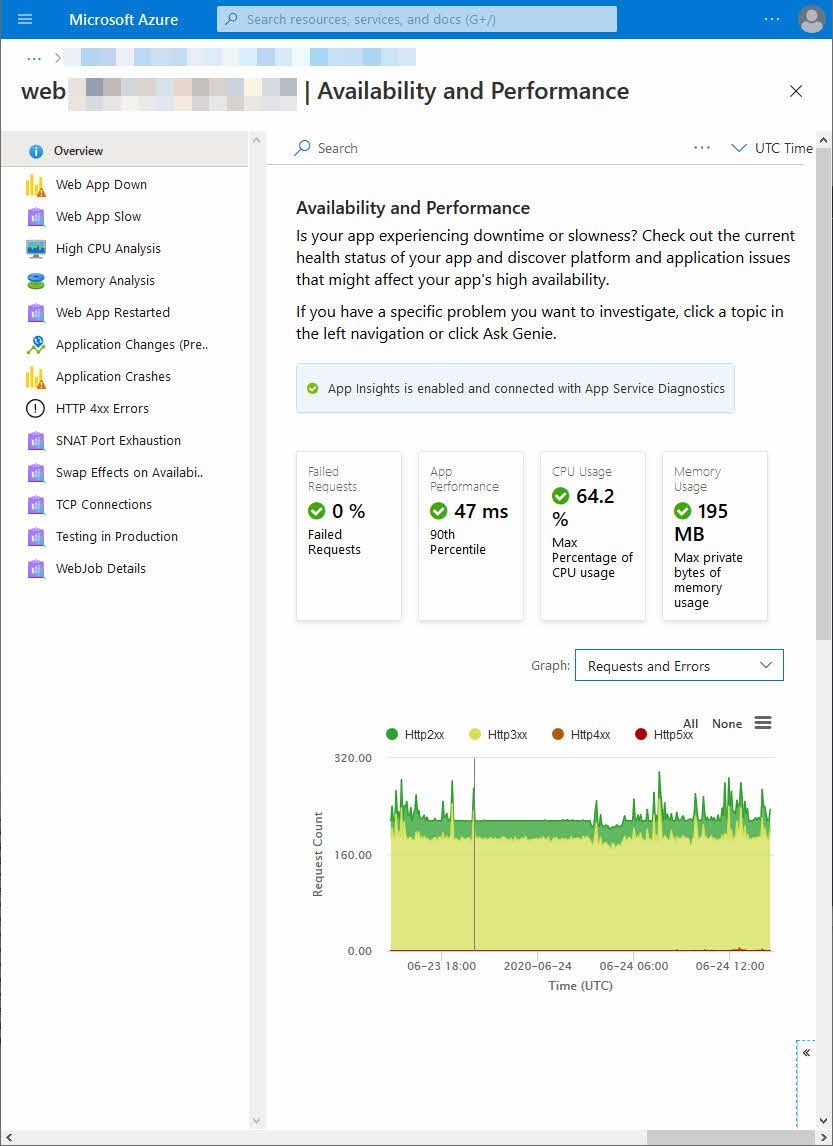
Availability and Performance
This is where you find out possible causes for downtime and degraded performance. Things like:
- Memory consumption
- CPU spikes and load
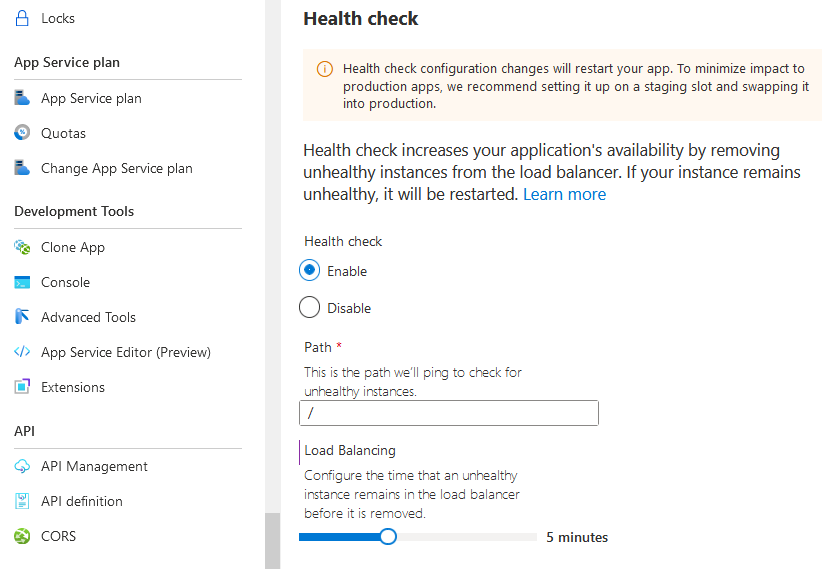
- Health Checks
- Downtime investigations
- 5xx, 4xx errors
- and more..
Configuration and Management
This is the section we use for things that could cause issues in our configuration. Mostly infrastructure things happening here, and a way for us to figure out if we’ve misconfigured anything.
- Deployment slot configurations
- Backup issues
- Scaling configuration misses
- Minimal TLS version checks
- Key Vault Application settings checks
- and a lot more useful checks…
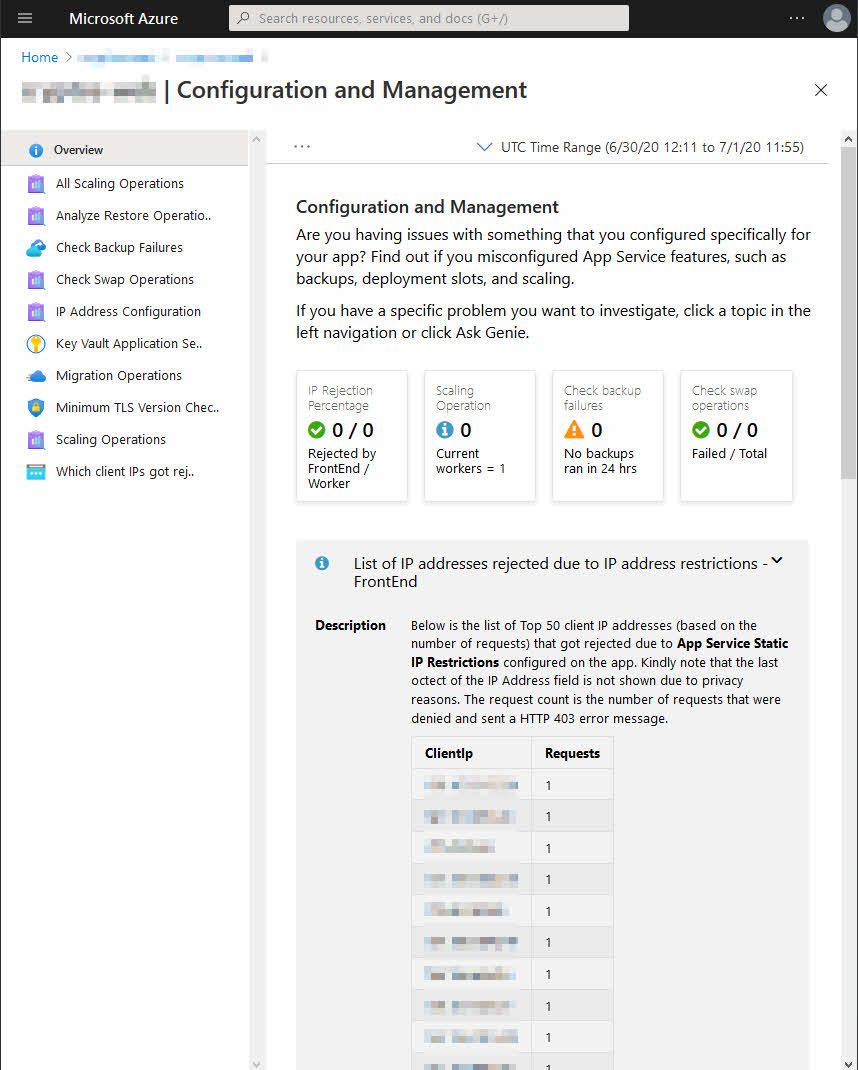
Overview of the Configuration and Management diagnostics for Azure App Services, from the Azure Portal
This section also brings you a guide for things you may have missed, like no running backups and no auto-scaling configuration, in case you’re running in production and need to handle a lot of spikes in the traffic.
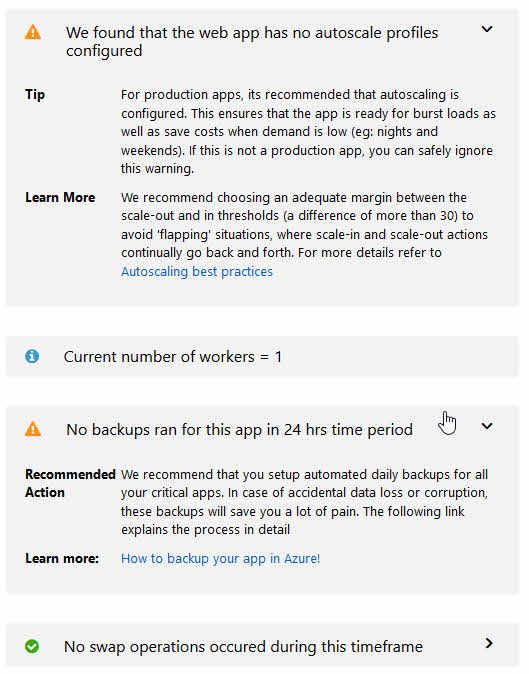
Azure App Service diagnostics with Configuration and Management, from the Azure Portal
Best Practices
Investigate whether or not you’re following configurational best practices for your app service. This is a great way to establish a baseline of configuration if you’re operating production workloads.
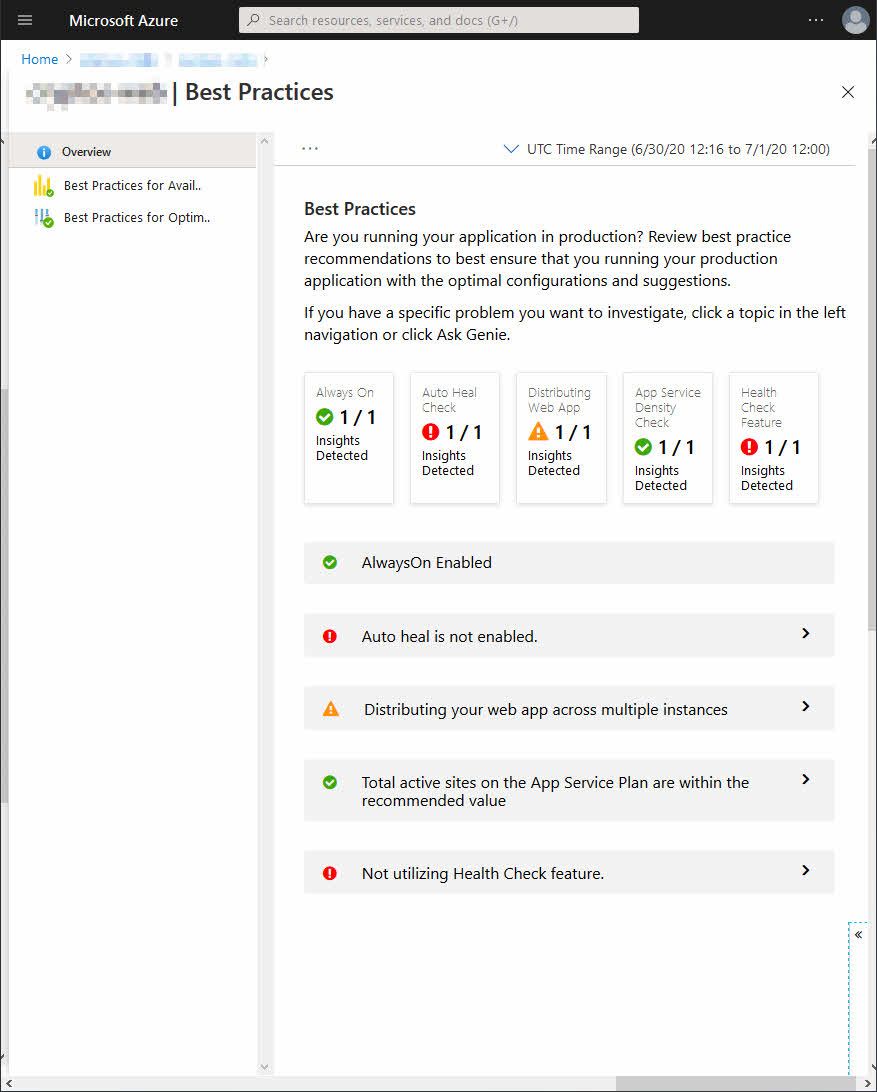
Overview of the Best Practices section under Diagnostics for an Azure App Service in the Azure Portal.
Looks like my spare-time project needs some love before I push that thing to the production subscriptions.
Navigator
At the time of this writing, the Navigator is in preview. Since I haven’t made any apparent changes recently, this is what I’ll see right now.
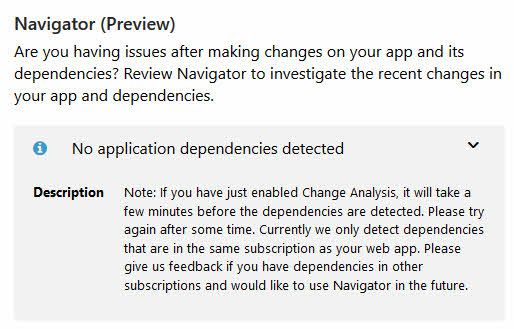
Azure App Service diagnostics using the Navigator to find changes to your app.
I did write about change analysis before, and it looks like the Navigator functionality in this diagnostics area are also relying on finding changes from the Change Analysis configuration.
For more info about enabling Change Analysis, and what that is, refer to this post:
Diagnostic Tools
This is a great section. Here are actionable tools for various tasks. Currently this section is split into three areas, with the below tools.
Proactive tools:
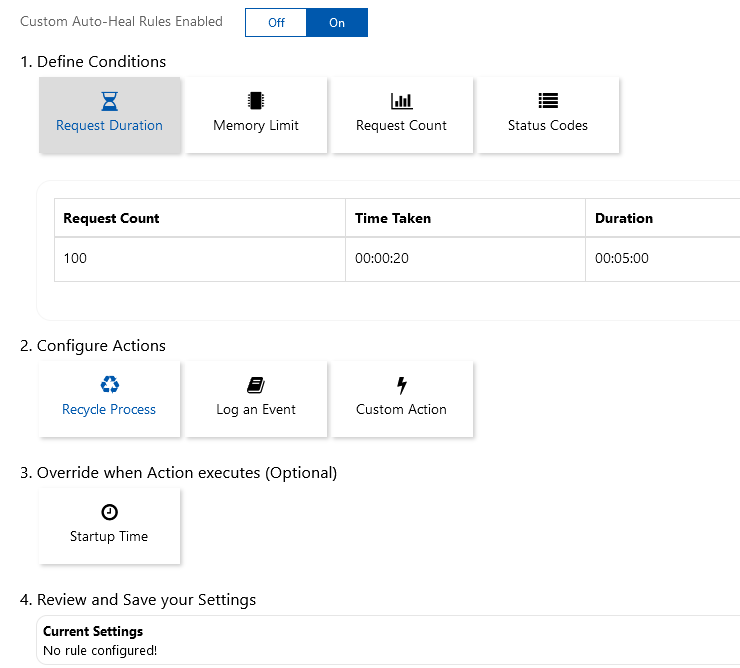
- Configure Auto-Heal
- Proactively monitor the CPU
Diagnostic Tools:
- Collect .NET Profiler Trace
- Collect Memory Dump
- Check Connection Strings
- Collect Network Trace
- Analyze PHP Logs
- Analyze PHP Process
- Collect Java Memory Dump
- Collect Java Thread Dump
- Collect Java Flight Recorder Trace
Support Tools:
- Metrics per Instance (Apps)
- Metrics per Instance (App Service Plans)
- Application Event Logs
- Failed Request Tracing Logs
- Advanced Application Restart
I can’t dive into detail about each of these tools here. It is likely that they change over time, and it makes more sense for you to navigate to your own Azure App Service and check out the diagnostics.
As an example, I started the “Collect Network Trace” tool:
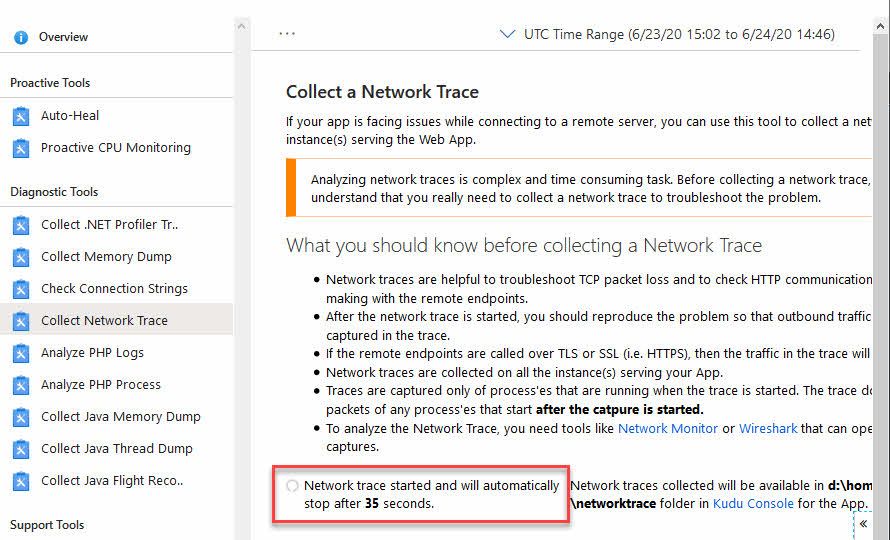
Starting a collection of Network Trace in the Azure App Service Diagnostics tool.
Voila, trace is done and you’re presented with the files containing the traces:
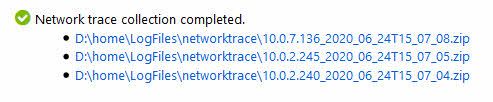
File location of the traces from the Network Trace collector.
Summary
This was a brief introduction and a post about raising awareness of these great built-in tools to help us better our development and operational excellence.
Azure App Services come with a lot of great features. It is not uncommon that I see teams invent new ways to solve problems, unaware of the features offered by Azure natively. I hope this can shed some light on how to easily troubleshoot workloads running on the Azure App Services.
Enjoy 🚀
Comments are closed