
Earlier this year, I wrote about Monitoring your Kubernetes cluster running on Azure Container Service (AKS) using Log Analytics. When I figured those things out, AKS was still in preview and it was a lot of things to tie together. The service has matured a lot since then, and there’s now better and easier ways to properly enable monitoring for your Kubernetes clusters in AKS - with Azure Monitor.
This post will walk you through how to configure and access the Azure Monitor add-on for AKS, which automatically creates the required monitoring resources for your cluster.
What can Azure Monitor do with AKS?
Microsoft has published a (currently Preview) documentation called Azure Monitor for containers (Preview) overview, which has a lot of info about the how and why of Azure Monitor for Containers. This is specifically for AKS (Azure Kubernetes Services).
Collected data include:
- Memory and Processor metrics for controllers, nodes and containers.
- Logs from the containers.
The data can then be accessed through Log Analytics for the AKS cluster, or in your global Azure Monitor instance.
Knowing that we can easily get up and running with logs for our containers, nodes and controllers - I’ll leave the abstract and get right to the point of how to implement this in two varieties:
- Enable Azure Monitor for an existing cluster.
- Create a new cluster and ensure Azure Monitor is enabled on creation.
Configure Azure Monitor for your AKS cluster
There’s a couple of different ways to get logging activated for your AKS cluster.
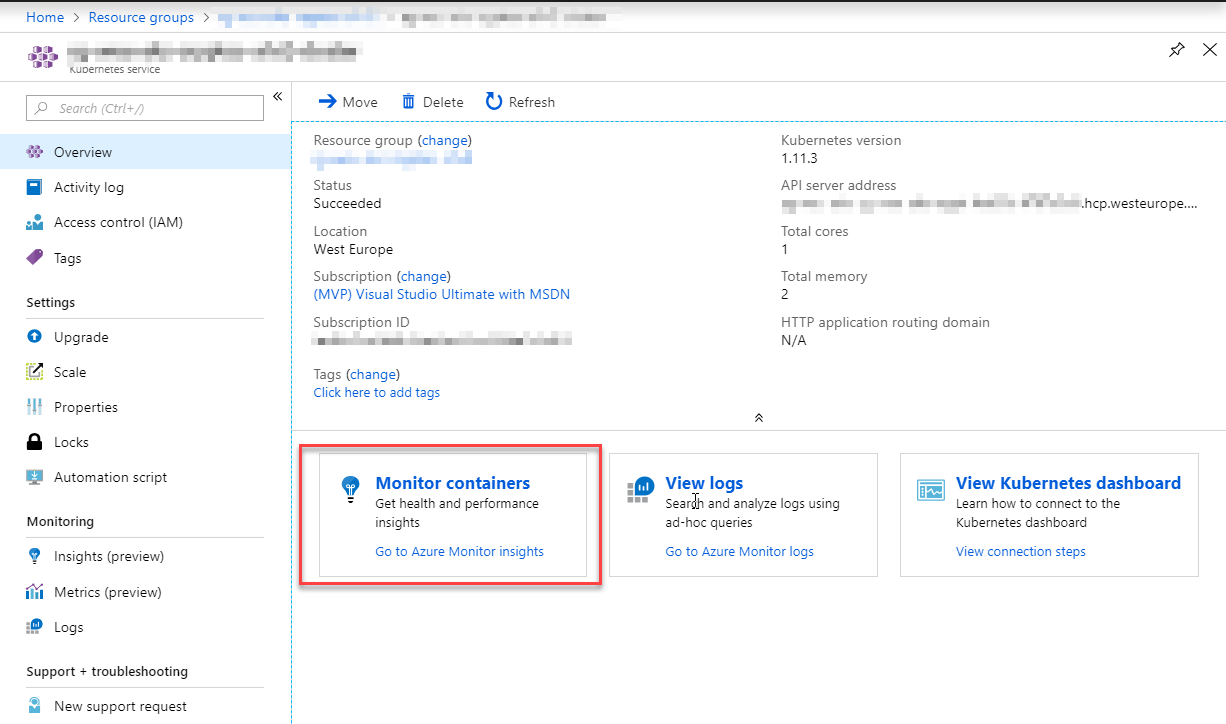
One is through the Portal UI:
Another way is to do it from the CLI, which is my personal favorite since I spend a lot of time managing, configuring and checking things through the CLI. So that’s what we’ll take a look at now.
Enabling Azure Monitor for an existing AKS cluster
An important thing to decide first is whether you want your cluster to send logs to an existing Log Analytics Workspace, or the default one in your subscription.
In the following sample I’m targeting the Workspace Resource Id of a specific Log Analytics workspace where I want to my logs to end up; Should you want to use your subscription-default workspace, or have it created if it doesn’t exist, then you just omit the last parameter for --workspace-resource-id.
First I’ll quickly find out the name and resource group of all clusters I have running:
az aks list -o tableThe result will give you the cluster names and resource group names you have, and you should find the one you’re going to target from there.
Next, let’s enable the add-on called monitoring for the AKS cluster. I will use the default log analytics workspace, but both commands are portrayed below so you can pick whatever fits your needs the best.
Target a specific Log Analytics workspace Resource Id:
az aks enable-addons -a monitoring -n rg-weu-my-cluster -g rg-weu-my-cluster-group --workspace-resource-id 4ab81b6f-c07d-d174-ef26-f4344bad14a
Use the default Log Analytics workspace:
az aks enable-addons -a monitoring -n rg-weu-my-cluster -g rg-weu-my-cluster-groupIt will take a few moments, and once it’s done we can use the show command to verify:
az aks show -n rg-weu-my-cluster -g rg-weu-my-cluster-groupThis should give you the general AKS info, including the following portion for addonProfiles:
"addonProfiles": {
    "omsagent": {
      "config": {
        "logAnalyticsWorkspaceResourceID": "/subscriptions/GUID/resourcegroups/defaultresourcegroup-weu/providers/microsoft.operationalinsights/workspaces/defaultworkspace-GUID-weu"
      },
      "enabled": true
    }
  },
This indicates that the omsagent profile is there, configured to the defaultworkspace-GUID-weu resource, which is the default Log Analytics Workspace in my subscription.
Awesome. Moving on.
Enabling Azure Monitor for a new cluster when creating a new cluster
Pretty much the same way as we just learnt in the previous section, we can use the --enable-addons parameter with the az aks create command to specify that we want the monitoring to be configured.
The command could look like this, depending on your other create-parameters:
az aks create -g rg-weu-my-cluster-group -n rg-weu-my-cluster --service-principal SERVICEPRINCIPAL --client-secret SECRETPASSWORD --location westeurope --node-vm-size Standard_A1_v2 --kubernetes-version "1.11.3" --node-count 1 --enable-addons monitoringWhatever approach you take to create your cluster (with, or without RBAC for example), the final bit would be the same:
--enable-addons montioringEt voila; the rest is the same as in the previous section.
Verify that the OMS agent is running in your cluster
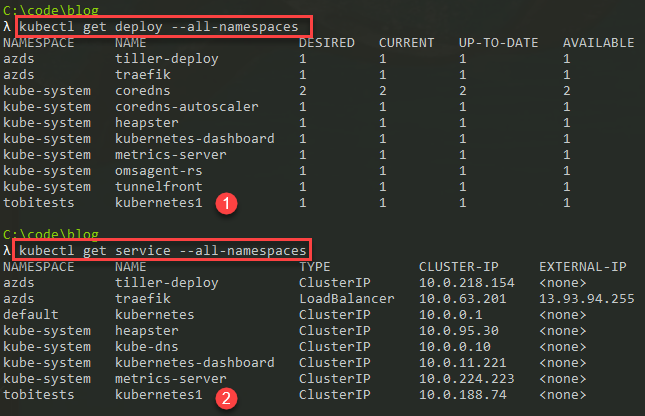
If you’ve configured the monitoring correctly, the omsagent daemonset should be running in your cluster and you should be able to see it under the namespace called kube-system.
To be sure, I’m listing all the deployments, regardless of namespace in this cluster:
kubectl get deploy --all-namespacesThe results look good, we have the omsagent-rs deployment in the kube-system namespace.
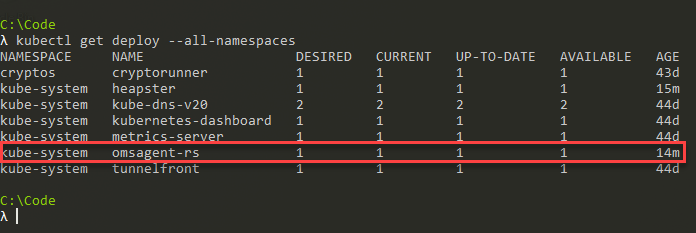
kubectl command shows that the omsagent is deployed.
That’s it, we have now enabled the Azure Monitor for AKS and Log Analytics will be populated with the performance metrics and container logs etc.
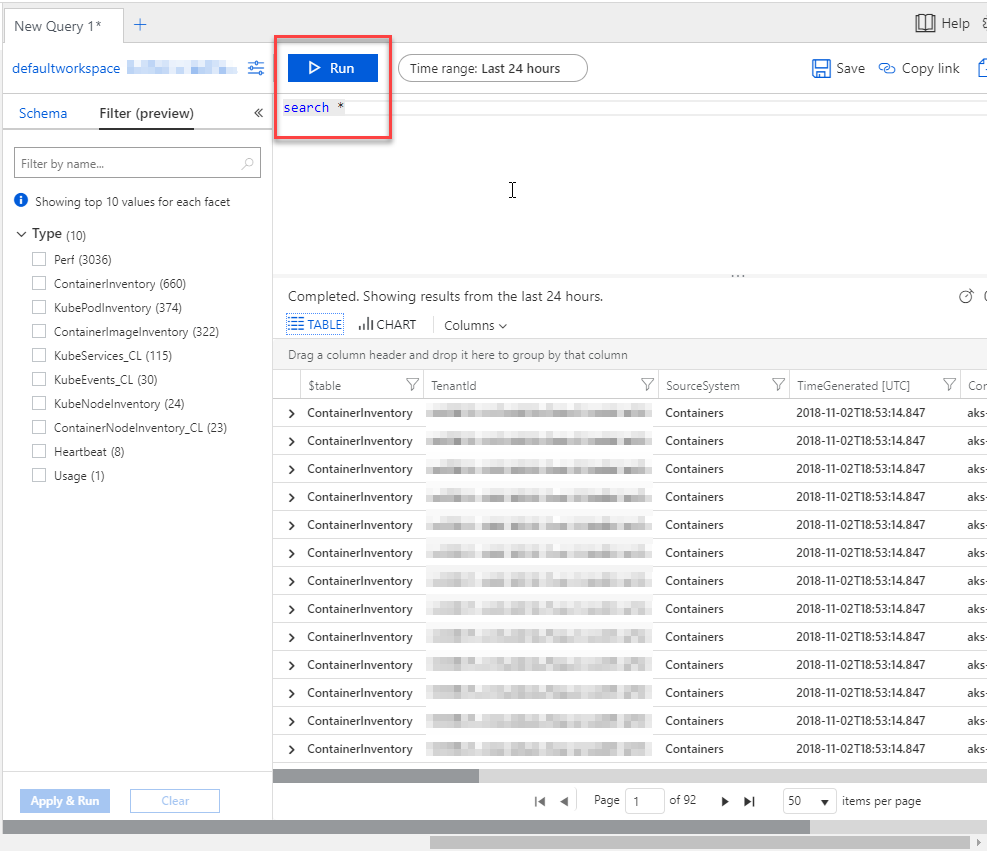
After only a couple of minutes, I can see that the logs are streaming in and that Log Analytics is getting populated with data from my AKS cluster.
In the Portal UI I simply execute the search * query to get all data in the last 24 hours, and I can see that something is happening.
To understand the data, I recommend the Understand AKS cluster performance with Azure Monitor for containers (Preview) docs from Microsoft.
Summary
We’ve successfully enabled Azure Monitor for our Azure Kubernetes Services cluster with a couple of lines in the Azure CLI. Now we can reap the benefits of using Azure Log Analytics to really drill down into what’s going on in our clusters.
If you haven’t used Log Analytics before, I would definitely recommend taking it for a spin. Especially if you’re running the managed Kubernetes offering from Microsoft (AKS) in your Azure subscription.
One of the key benefits I like with Log Analytics for the production-grade clusters, is the immense amount of data it can handle and let me work with. Troubleshooting and filtering down through the logs is super easy, quick and it just works. Log Analytics comes with a pretty complex query language which helps a lot, and the Portal UI is awesome and makes it very simple to drill down into the data - and my final personal favorite is the visuals that it can create from the logs. Both custom logs and the generated ones from the machinery.
That’s a wrap! Please feel free to leave a comment.

Comments are closed