UPDATE AUTUMN 2018:
Microsoft recently released a Preview of Azure Monitor integration with AKS.
Read more about how to enable it here: https://zimmergren.net/enable-monitoring-with-azure-monitor-log-analytics-for-aks/
OBSOLETE: Please note, as the previous comment and link above suggest, the information here is now obsolete since it was written during the Preview of AKS.
Please use the link above to navigate to the simplified, and updated, information about how to get this running!
One of the things I’ve noticed many times over the last year working with different orchestrators, distributed cloud platforms and container systems is that without proper monitoring and logging, you’ll be in a world of pain when trouble hits you.
A solution to this problem can come in many shapes and with the help of many tools and services. In this article I’m focusing on Microsoft Log Analytics which has support for monitoring Kubernetes (and other systems).
AKS Kubernetes monitoring: Pre-requisites for this post
A short list of things you’ll need before you get started:
- An Azure Container Service (AKS) cluster in Azure
- Azure CLI (Download here)
- Azure AKS ClI (See here how to install)
Read my previous post about Getting started with AKS for more details and step-by-step of setting things up from scratch - then you’re ready to follow along with the below.
Step by Step: Setting up Container Monitoring Solution for AKS
1. Create the Container Monitoring Solution in Azure Portal
-
Head on over to your Azure Portal
-
Click the Add button to create a new Resource
-
Search for
Container Monitoring Solution: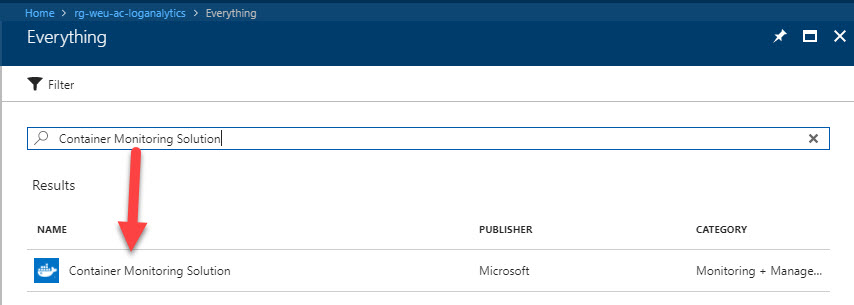
-
Select it and hit
Create: (You don’t have to hit it, you can just press it)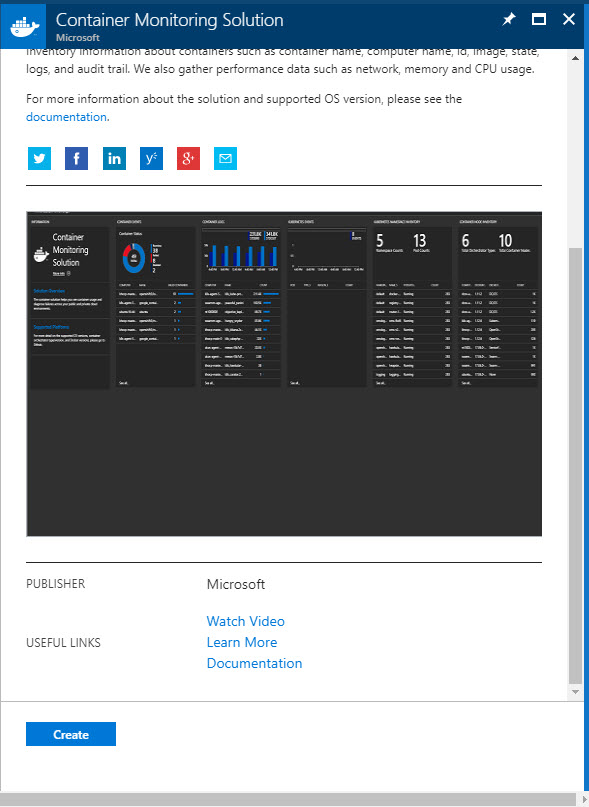
-
Once the creation of the
Container Monitoring Solutionis done, you can follow these steps to ensure you set up a new OMS (Operations Management Suite) Workspace for our monitoring: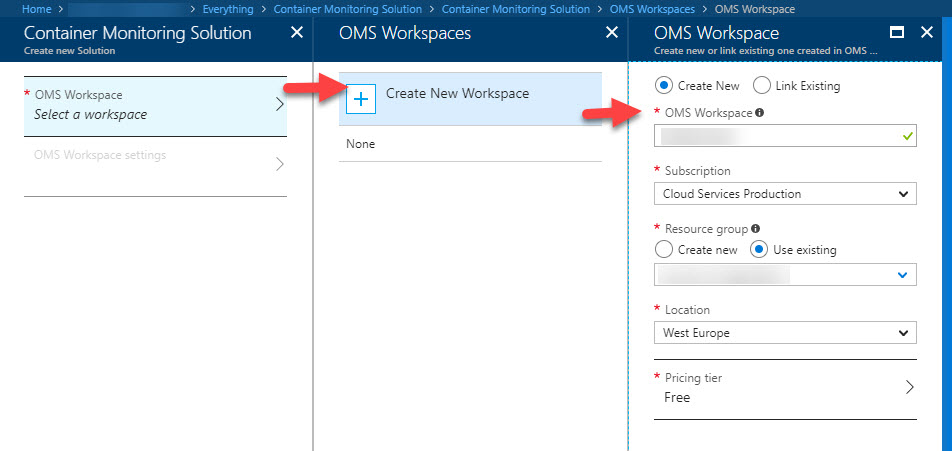
-
Review the selections and hit
Create: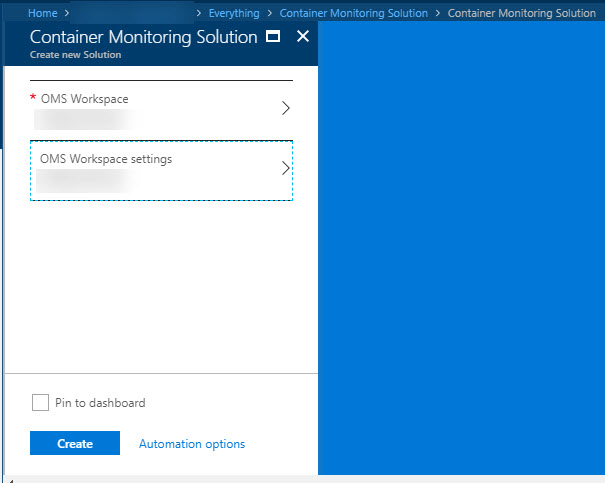
-
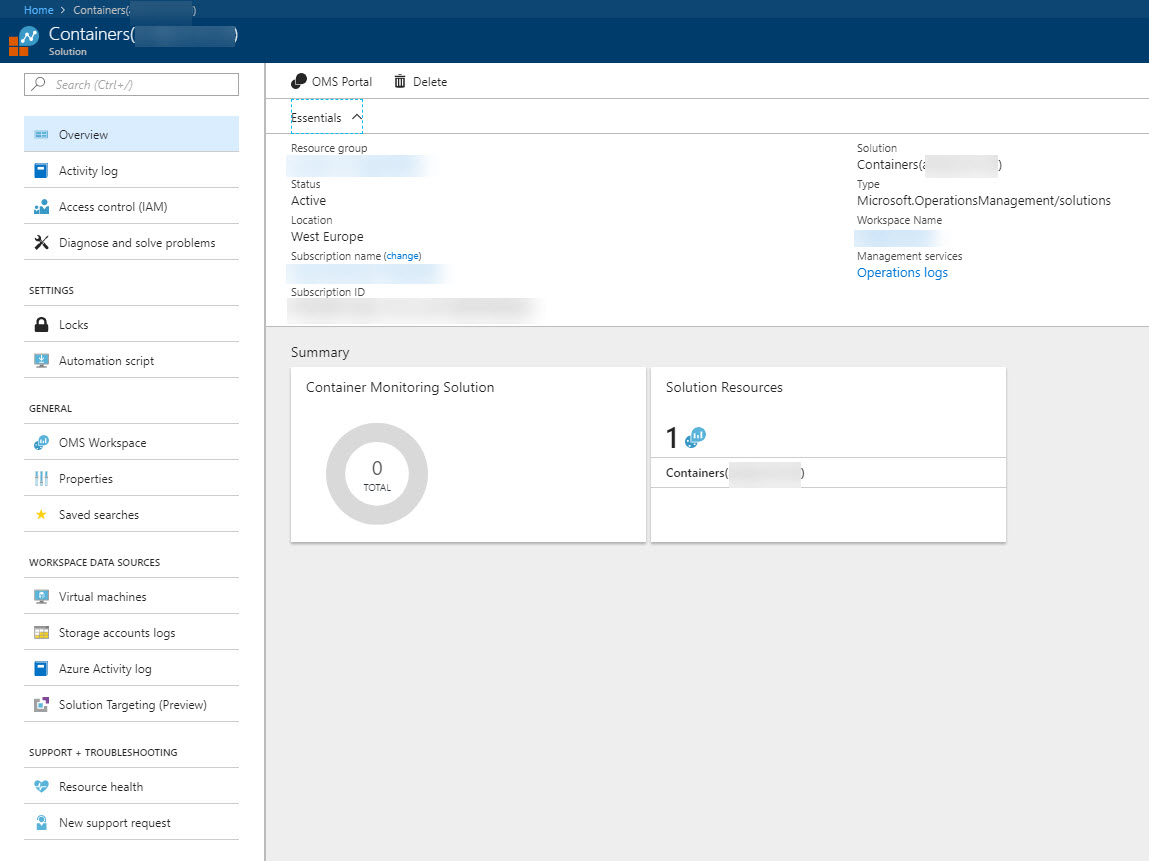
Resources are (hopefully) successfully created:
2. Retrieve the OMS Workspace ID and Primary Key
In order to create the monitor containers (yep, funnily enough we’ll use containers to monitor our container orchestrator), you need to fetch a Workspace ID and Primary Key for this new OMS Workspace we have created. If you’re familiar with Application Insights, it works in a similar fashion - you specify an ID (and also a key) to where you want to send the logs, which is in Azure Log Analytics that is part of the Container Monitoring Solution and OMS Workspace we created above.
Follow along with these three simple steps:
-
Go to
OMS Workspacefrom your left navigation of your Container Monitoring Solution: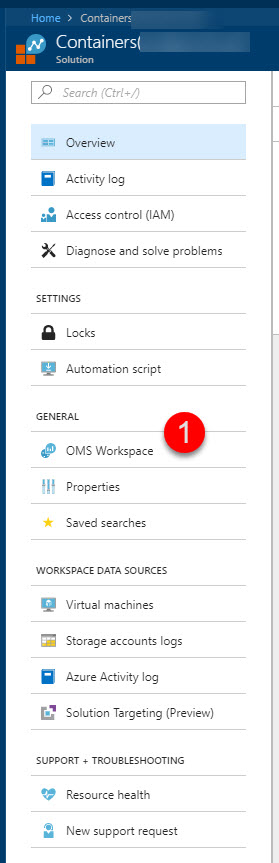
-
From inside your OMS Workspace, select
Advanced settings: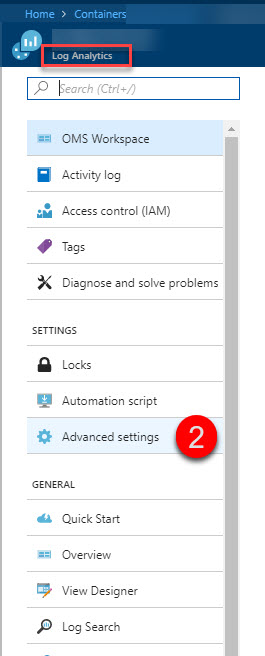
-
Select
Connected Sources>Windows Serversand make a note of theWORKSPACE IDandPRIMARY KEY. You will need them in the next steps: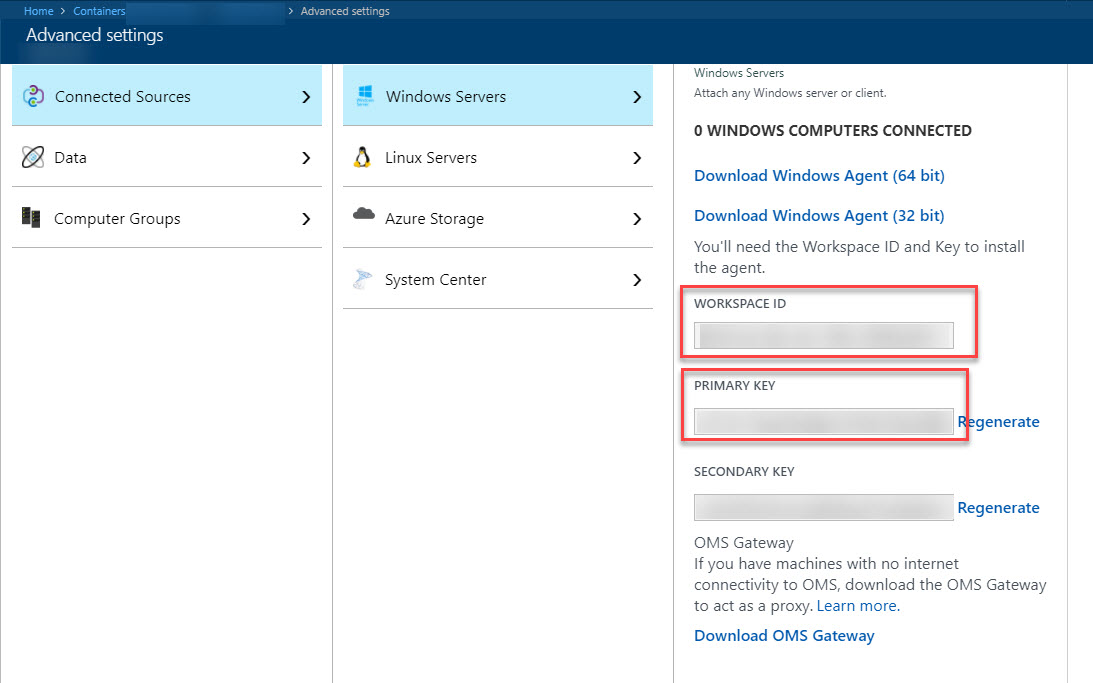
Greatness unlocked - high five!
Well, not really but at least now we have the details we need to configure the DaemonSet in Kubernetes which deploys the Microsoft/OMS docker image to all of the nodes in your Kubernetes system.
3. Deploy a DaemonSet with the microsoft/oms image
In order to monitor our Kubernetes cluster in AKS, we need to deploy a container of the microsoft/oms image onto each node in our system. We want to use these to send log analytics data back to our Azure Log Analytics (part of the Container Monitoring Solution).
Remember the Workspace ID and Primary Key you were supposed to copy in the previous section?
Well this is where we will use them. Replace the text blocks for YOUR_WORKSPACE_ID_HERE and YOUR_PRIVATE_KEY_HERE with your corresponding values.
This file originally comes from here, and you will likely find updated versions here. My recommendation is to grab the latest one from this repository to ensure you’re not deploying legacy images (depending on when you’re reading this):
https://github.com/Microsoft/OMS-docker/blob/master/Kubernetes/omsagent.yaml
apiVersion: extensions/v1beta1
kind: DaemonSet
metadata:
 name: omsagent
spec:
 template:
  metadata:
   labels:
    app: omsagent
    agentVersion: 1.4.0-12
    dockerProviderVersion: 10.0.0-25
  spec:
   containers:
     - name: omsagent
       image: "microsoft/oms"
       imagePullPolicy: Always
       env:
       - name: WSID
         value: YOUR_WORKSPACE_ID_HERE
       - name: KEY
         value: YOUR_PRIVATE_KEY_HERE
       securityContext:
         privileged: true
       ports:
       - containerPort: 25225
         protocol: TCP
       - containerPort: 25224
         protocol: UDP
       volumeMounts:
        - mountPath: /var/run/docker.sock
          name: docker-sock
        - mountPath: /var/opt/microsoft/omsagent/state/containerhostname
          name: container-hostname
        - mountPath: /var/log
          name: host-log
        - mountPath: /var/lib/docker/containers/
          name: container-log
       livenessProbe:
        exec:
         command:
         - /bin/bash
         - -c
         - ps -ef | grep omsagent | grep -v "grep"
        initialDelaySeconds: 60
        periodSeconds: 60
   nodeSelector:
    beta.kubernetes.io/os: linux
   # Tolerate a NoSchedule taint on master that ACS Engine sets.
   tolerations:
    - key: "node-role.kubernetes.io/master"
      operator: "Equal"
      value: "true"
      effect: "NoSchedule"
   volumes:
    - name: docker-sock
      hostPath:
       path: /var/run/docker.sock
    - name: container-hostname
      hostPath:
       path: /etc/hostname
    - name: host-log
      hostPath:
       path: /var/log
    - name: container-log
      hostPath:
       path: /var/lib/docker/containers/
I have chosen to name my file kubemonitor.yml. You can name yours however you want.
Now we need to send this definition over to the AKS cluster, and we’ll do that using the kubectl command. This should be available to you if you’ve followed the pre-requisites about setting the tooling up, and if you followed my previous post with steps for setting up AKS.
kubectl create -f kubemonitor.yml
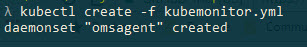
Okay now it’s high-five time again. So far so good, let’s continue to verify that our stuff has actually been deployed and that we can see the monitoring data come in to our Azure Log Analytics / Azure Container Monitoring Solution.
4. Verify DaemonSet deployment and that containers are running
You can use two ways to verify that the daemonset was successfully deployed.
Option 1. Verify using CLI with kubectl
To verify that the deployment of the daemon set succeeded and that it all works, you can fun this command in the CLI:
kubectl get daemonset
A successful output should look similar to this:
NAME       DESIRED   CURRENT   READY     UP-TO-DATE   AVAILABLE   NODE SELECTOR                 AGE
omsagent   2         2         2         2            2           beta.kubernetes.io/os=linux   9d
On this rather small AKS infrastructure I’m only running 2 nodes, and it looks like they’re happy.
Option 2. Verify using the Kubernetes Dashboard in AKS
Even though the CLI is awesome, sometimes it’s nice to visually verify and see things you’ve done. So the other option is to launch the Kubernetes dashboard in AKS and verify the deployment by ensuring that you can see the DaemonSet there.
az aks browse -g myResourceGroupName -n myAksClusterName
-
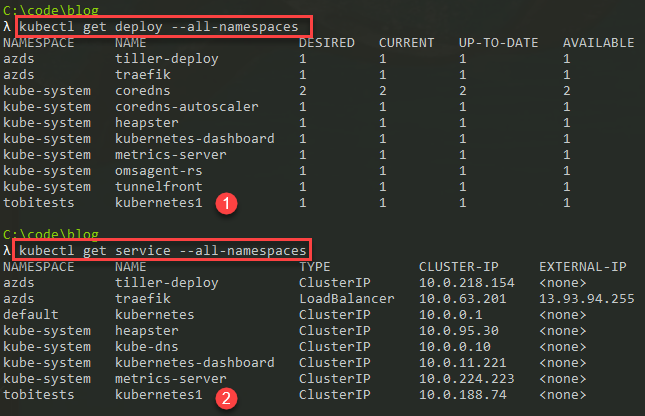
You can ensure from the Overview page that there is indeed a daemonset called omsagent (as per the yaml definition file, where we specified the name
- name: omsagent). It’s deployed with 2 pods, indicating I have two nodes which have both been successfully covered by the monitoring containers: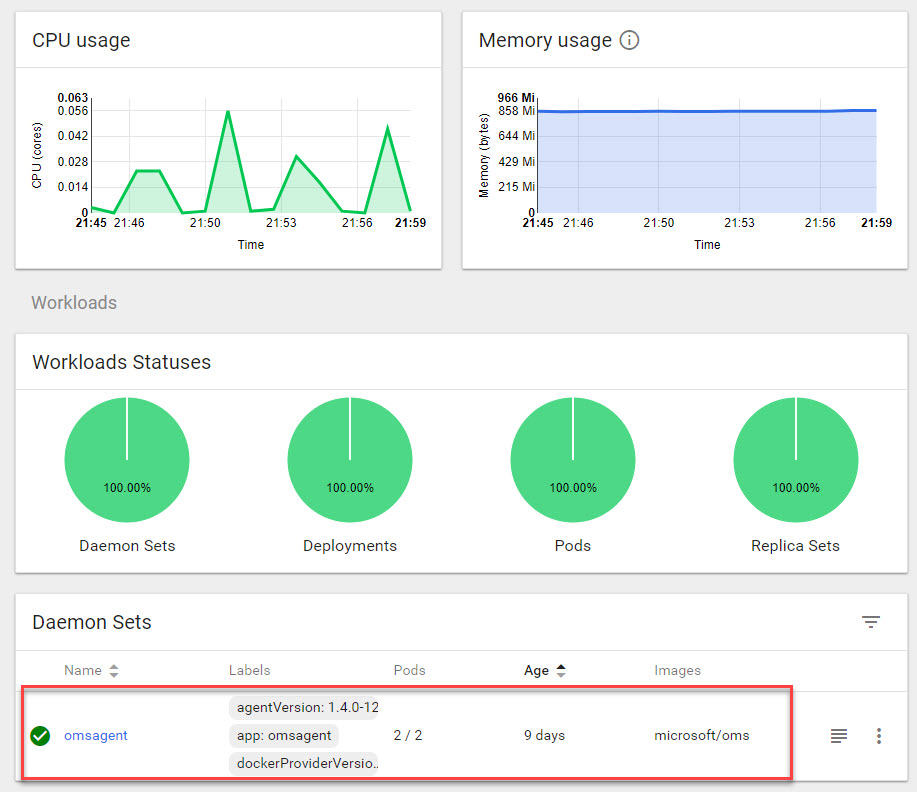
-
Click on
DaemonSetin the navigation and ensure that you can see all of your nodes here under thePodssection. It should be deployed to all nodes in your cluster: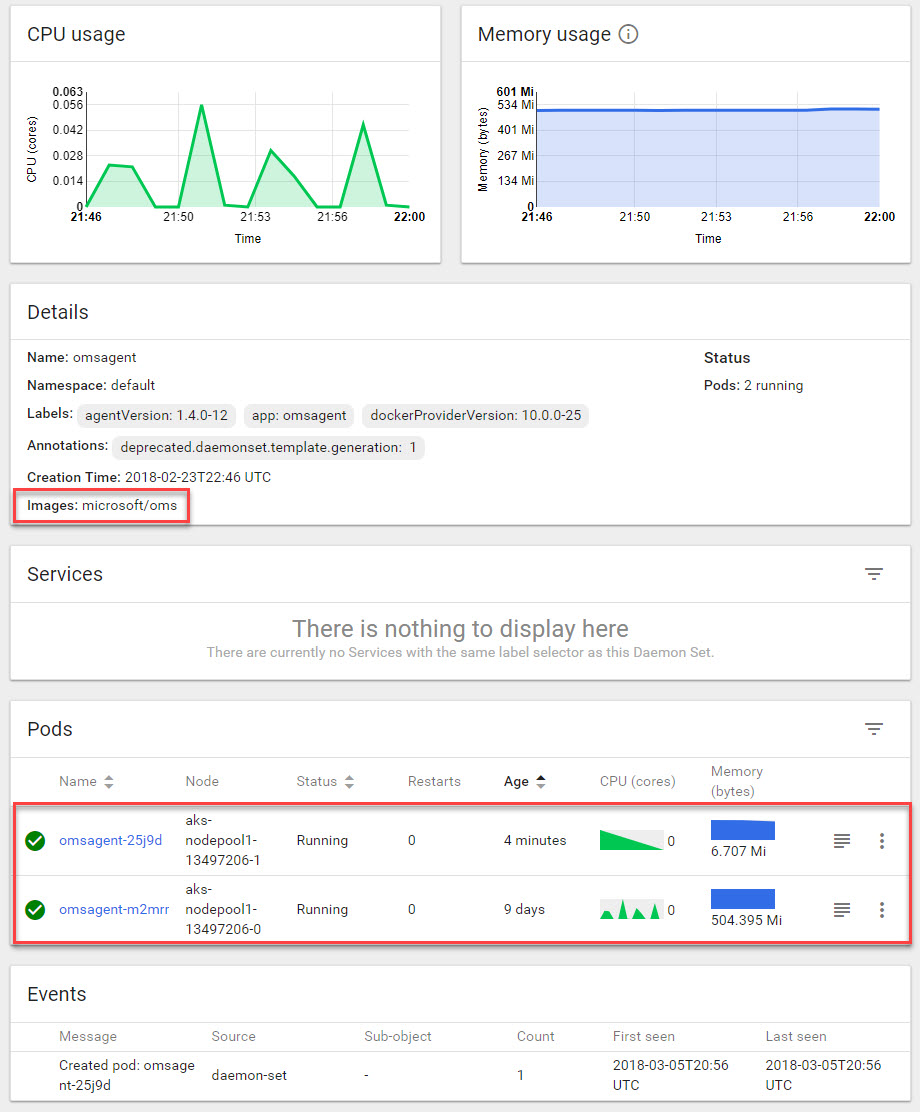
5. Verify the logs in your Azure Container Monitoring Solution
So far we’ve:
- Created a Container Monitoring Solution (OMS, Log Analytics)
- Defined and deployed a daemonset with the containers to monitor our system
- Verified that it worked.
But there’s one thing remaining: Verify that the logs are actually working and that we are indeed getting data back to our dashboards.
-
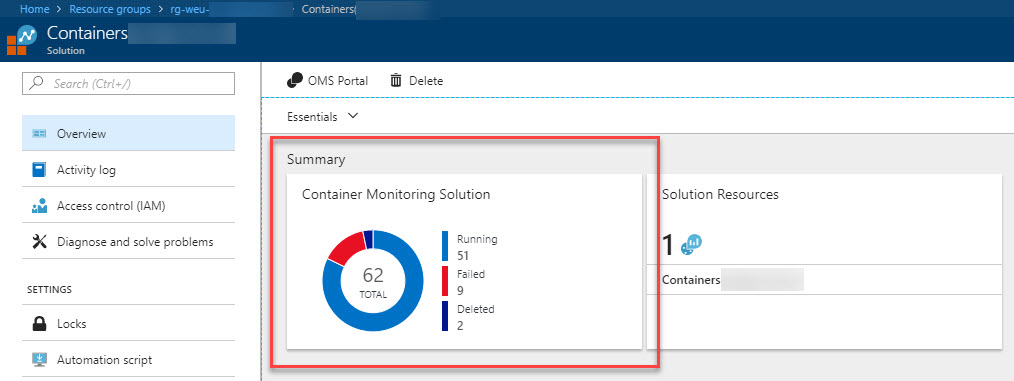
Head back to your Azure Portal and open the
Container Monitoring Solutionthat you previously created -
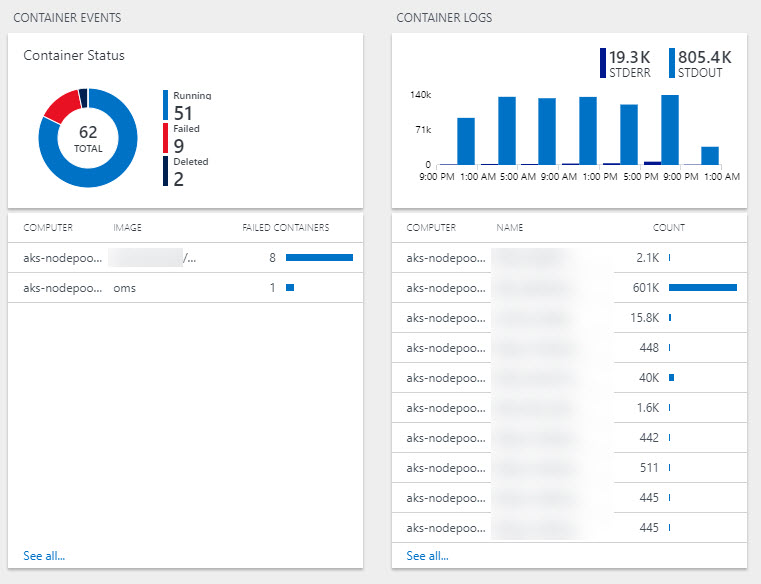
The information from your Kubernetes AKS deployment should be showing up in the dashboards:

-
Click the left chart (marked above) and you will get to a more detailed dashboard containing lots more data (image cropped):
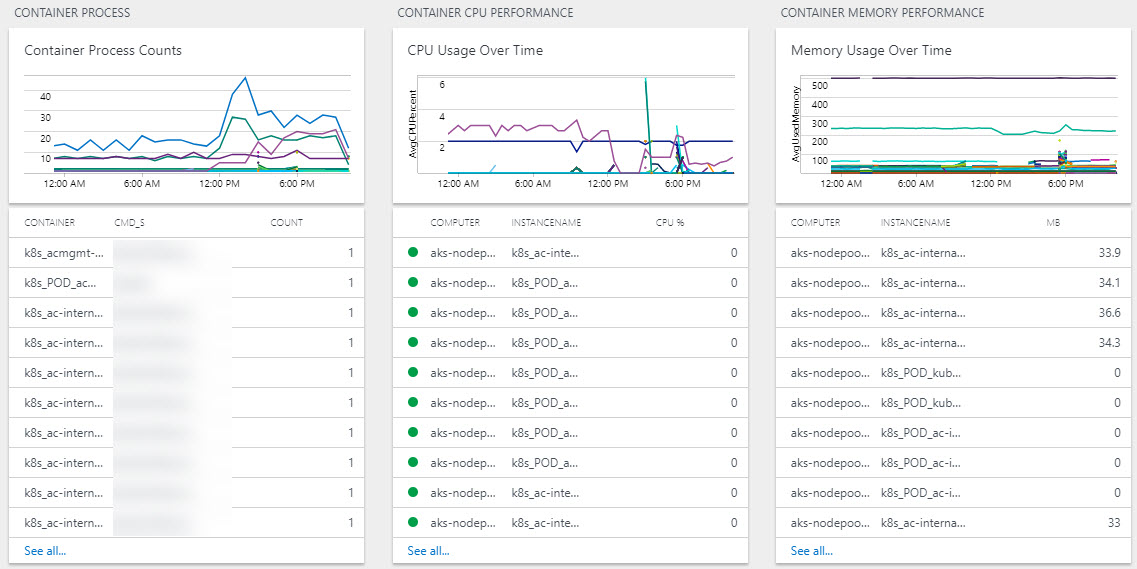
-
The sideway-scroll on this page is ridiculous. There’s plenty more summarize boxes where these came from. Showing just a few of them here with their details.
-
The more useful and exciting data comes in the
Log Searchfeature of Log Analytics, where you define and execute custom queries: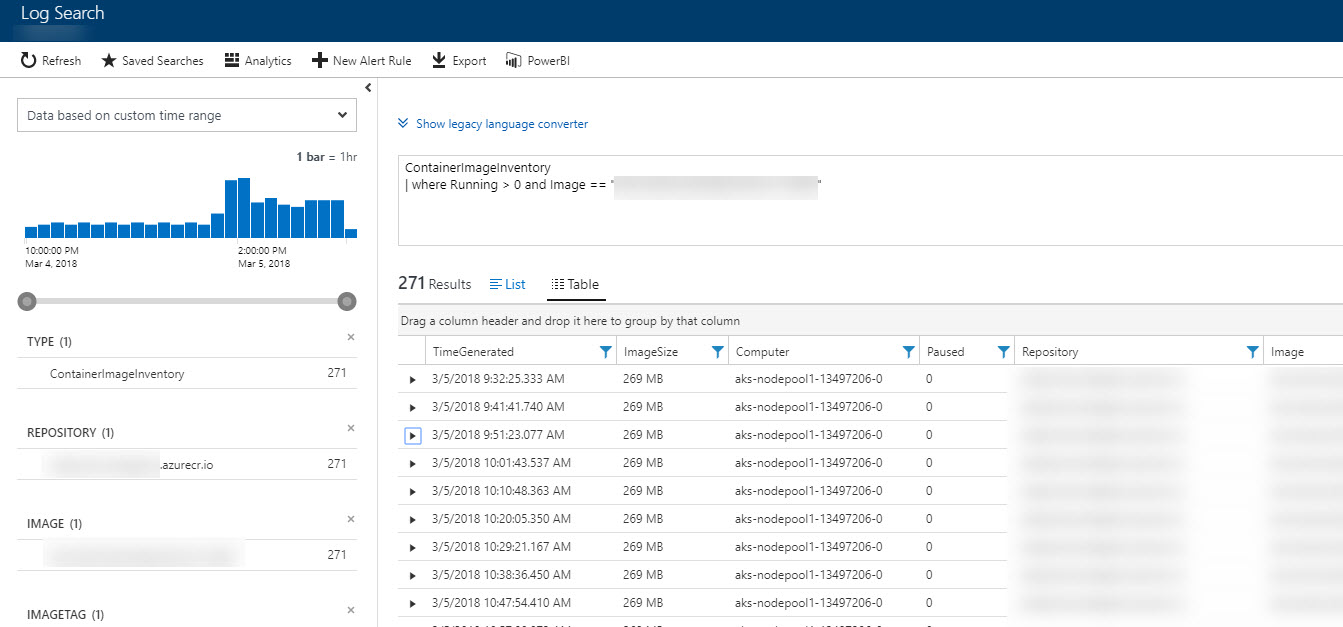
6. More in-depth Log Search with Log Analytics
-
On the simplistic dashboard of your new Container Monitoring Solution, there’s a button called
Analytics. Click it: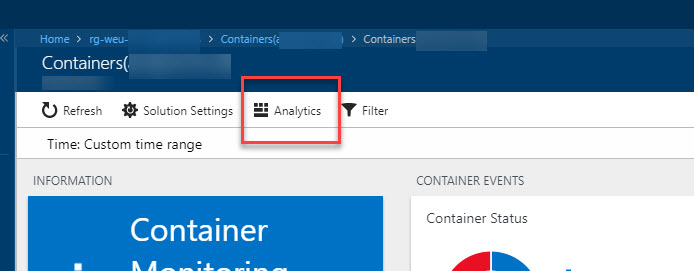
-
This will redirect you to a
https://portal.loganalytics.iourl, specific for your monitoring solution, and this is where Azure Log Analytics really comes into play: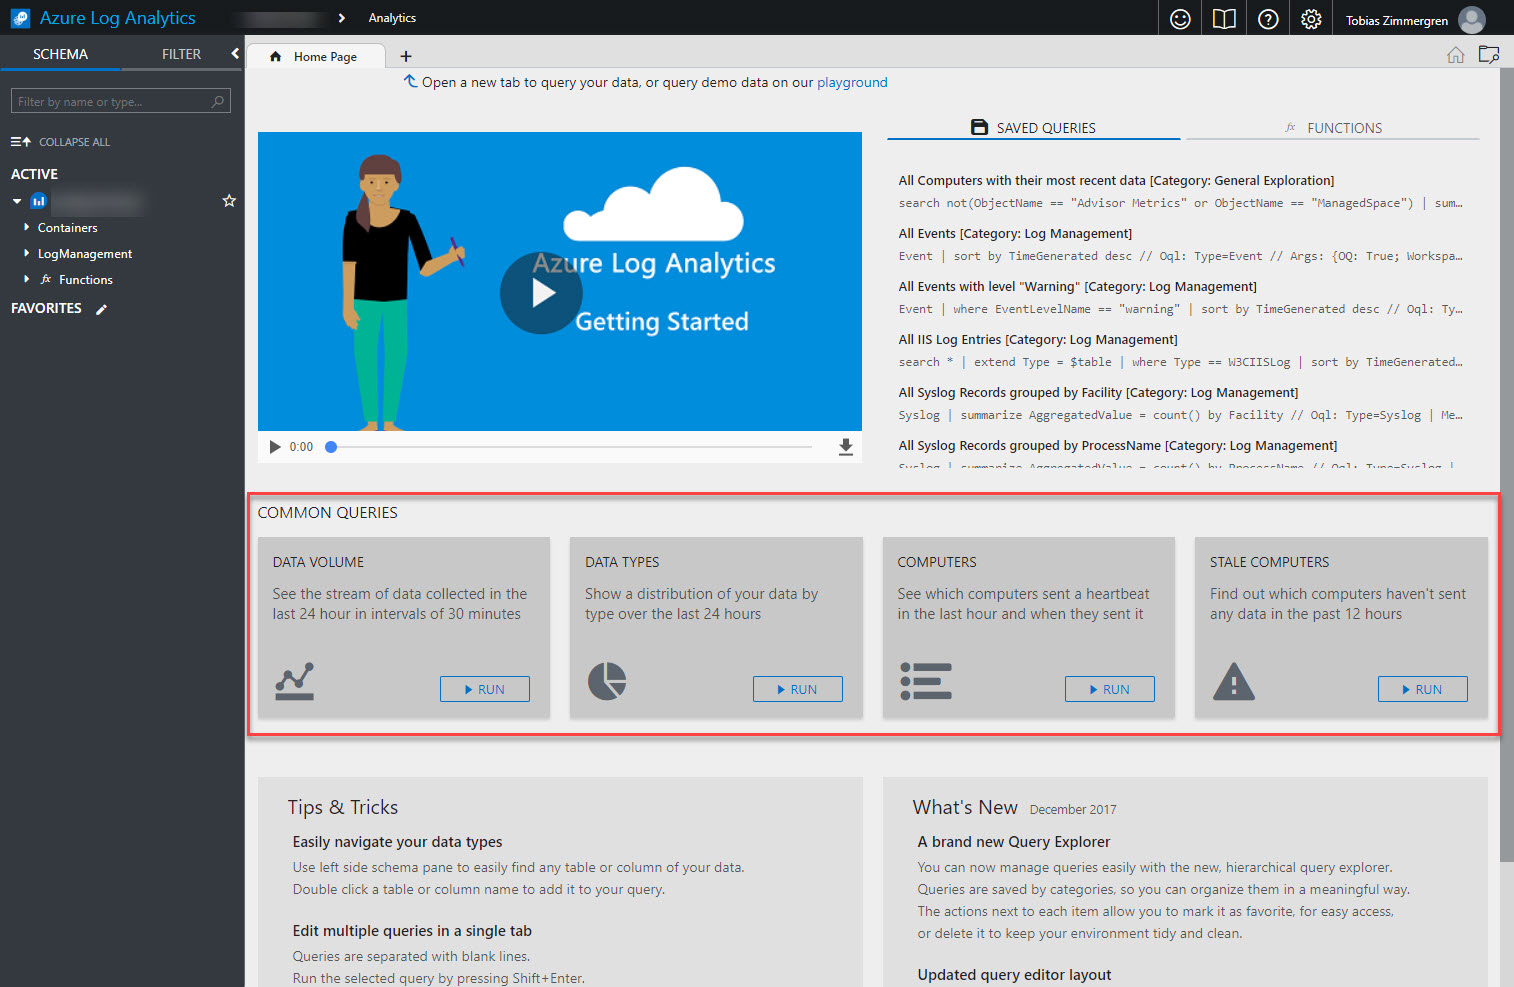
There is a handy section with “Common Queries” where you can easily just click “Run” on any one of them to execute and see the results.
I’ve got quite a lot of data in my real dashboards right now, and should I grab a screenshot of it I’d likely have to blur all of the screenshot picture out, so I’ll leave it to you to check your own logs.
Go ahead, try it out. It’s not only fun - it’s also very insightful and will bring you many ideas for how you can (and should) monitor your Azure Container Services (AKS) system with Kubernetes and Azure Log Analytics. It’s pretty neat.
Summary
With that, we have integrated monitoring from Kubernetes and AKS to your normal Azure Portal.
If you’re aiming to be running your Kubernetes cluster in production with AKS, you’ll need something like this. While there’s other solutions out there, I’ve found this to be pretty straight forward to deploy and also pretty sweet to configure.

Comments are closed