I have recently been extensively using the Microsoft Application Inspector to fulfill a few of my business cases. The Application Inspector is a source code characterization tool. This tool helped me quickly grasp where we are using authentication, authorization, and cryptographic algorithms we are using in our code base.
At this point, one might wonder: “why not use any of the SAST (Static Application Security Testing) tools available for this?”.
Great question. The answer is somewhat straight forward. We are not looking for issues or vulnerabilities specifically - we are making an inventory to understand what we have.
The traditional code analysis tools give you a yay or nay on your code; this gives us insights into what we have without making a judgment call whether or not its good or bad.
When jumping into a new big solution or project, this tool helped me better understand what we have.
What can the Application Inspector discover?
The Application Inspector discovers a variety of things in your applications. This tool shouldn’t be mistaken for a traditional code analysis tool that finds issues and vulnerabilities. Instead, this tool helps grasp what types of features we are using from our code—an inventory-like assessment.
You’ll see further down in this article how the reports look. Seeing the data and drilling down into them makes it easier to understand the capabilities of what the tool can discover.
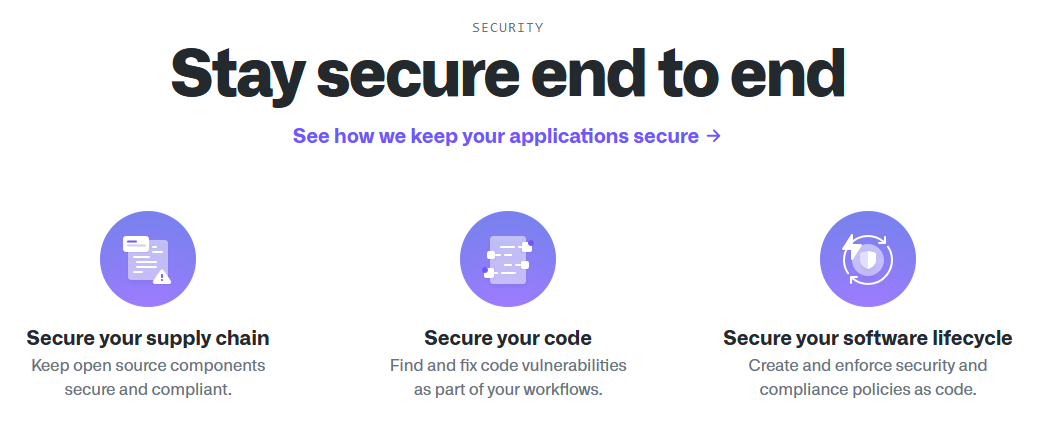
For example, the Application Inspector gives us an overview of frameworks we use, cloud APIs we are calling, cryptographic algorithms we are making use of, and discovering PII, OS-level functions, authentication/authorization features, and more.
Currently, the following programming languages are supported: C, C++, C#, Java, JavaScript, HTML, Python, Objective-C, Go, Ruby, PowerShell
Read more about language support on the GitHub repo.
How can I run the Application Inspector?
Great question. There are many ways you can run the Application Inspector. Since it’s a console application, you can tie it into any pipeline you want.
Further down in this article, I’ll talk about running it manually on the source code you have on your machine.
You can also run it as part of your build pipelines and continuously export updated inventory reports.
- AppInspector GitHub Action by Microsoft
In addition to the free AppInspector GitHub Action, you can, of course, integrate the binary (console app) into your Azure DevOps pipelines, or anything else that fits your scenario.
Getting started with Microsoft Application Inspector
Let’s get to the interesting parts. Testing something out is always more fun, and at least for myself, makes it a lot easier to understand what the true value of any tool is.
Get the App Inspector binaries
This is the easy part. Head over to the GitHub Releases page and grab the latest binaries and install for your system. As of this writing, the release cadence is several times per week, which gives me comfort knowing that the project is actively maintained and new releases are made available on a regular basis.
I dropped the binaries into my C:\code\appinspector folder, for reference.
Run App Inspector
I love the new Windows Terminal. I’ll make use of that as my command line tool.
To run the tool now, we just need to run the appinspector.cli.exe, as well as point to a folder containing our source code. Here’s how:
applicationinspector.cli.exe <command> <options>
Here is an example when I’m running it on one of my open source projects:
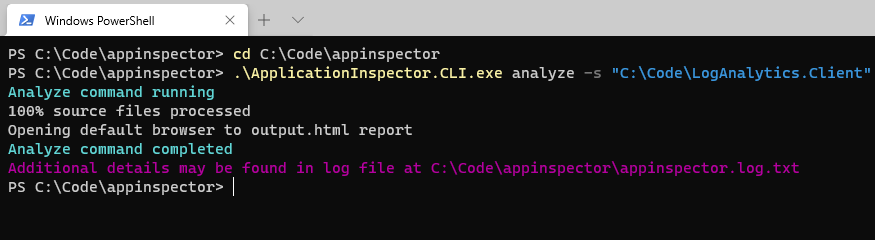
Running Microsoft Application Inspector to discover what’s in the source code.
Viewing the reports
When the discovery has completed, you can access the reports. These are made available in various formats:
- HTML. Beneficial for viewing and comprehending the data.
- JSON. Beneficial when you need to tie the results into another system.
There are two main areas of the HTML report.
- Summary.
- Features.
Summary View
The summary simply gives you insights into what you have in your code, as a high-level overview. Here’s an example of one of my solutions I ran through the discovery:
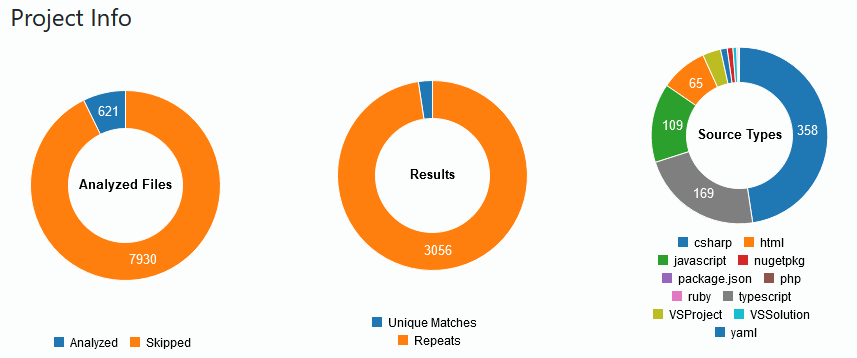
Application Inspector displaying the summary report.
From the summary page you can also drill down into the tags. This is a list of unique tags found that matches one of the rule patterns. I like the ability to navigate this tag list and click items to discover where in my code I’m making use of something - for example cryptographic algorithms.
Select something from the list:
Select the tag from the list in Application Inspector.
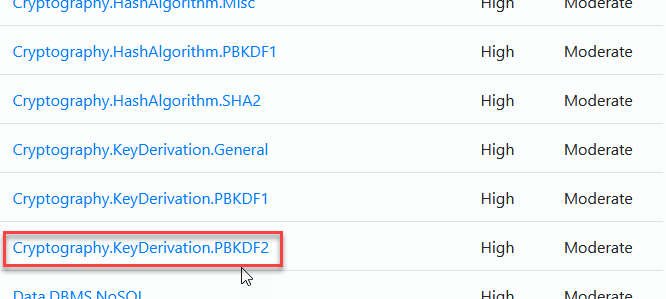
The list filters and shows you associated rules where there are matches:
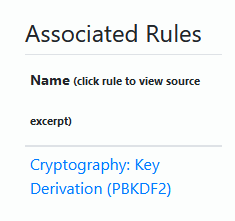
Associated rules for a pattern match by the Application Inspector.
Clicking on the name gives you a view into your source code where the patters was matched:
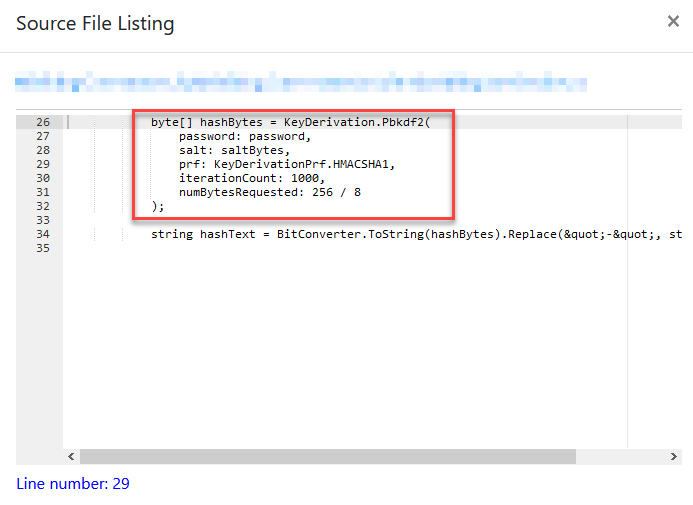
Displaying a match for the associated rule in the Microsoft Application Inspector.
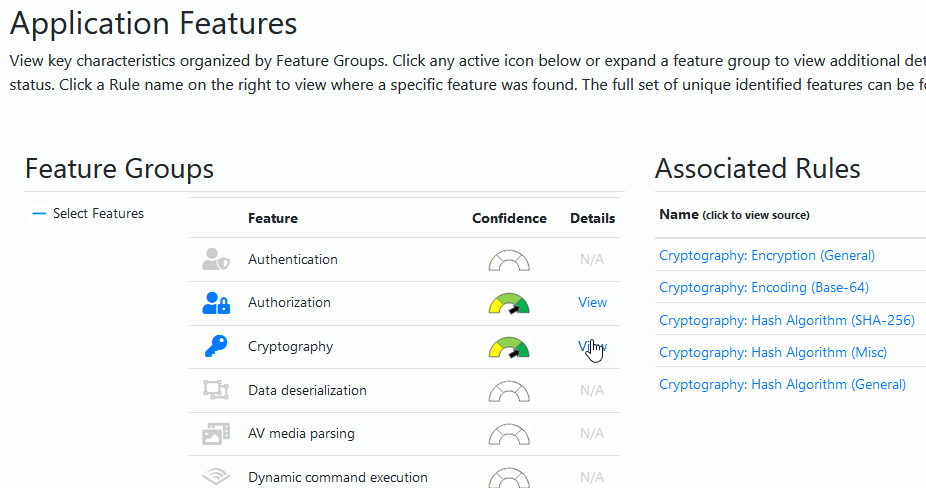
Features view
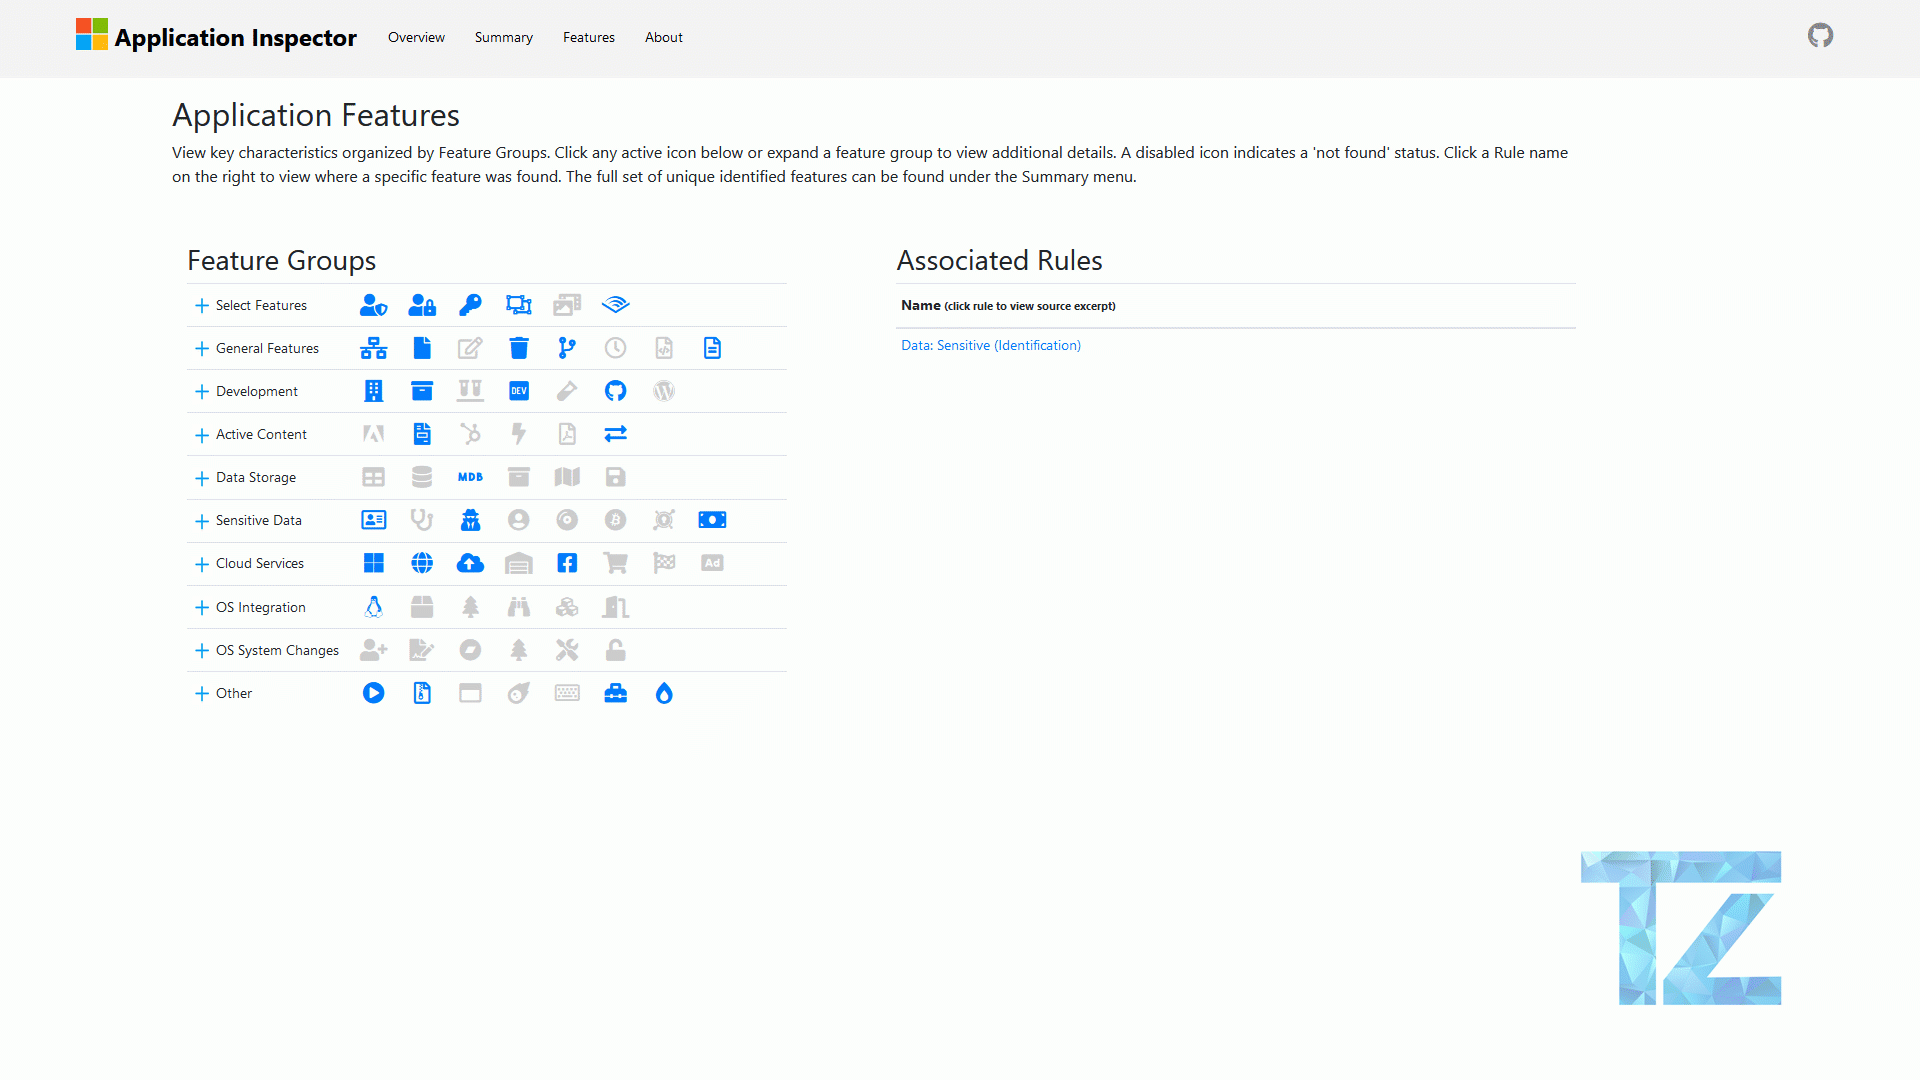
Great, we know that we can drill down into the code by tags that we discovered. Another great feature is the Features view where we can see things light up with visual icons where the code is making use of a particular type of feature.
Here’s the feature overview of my code.
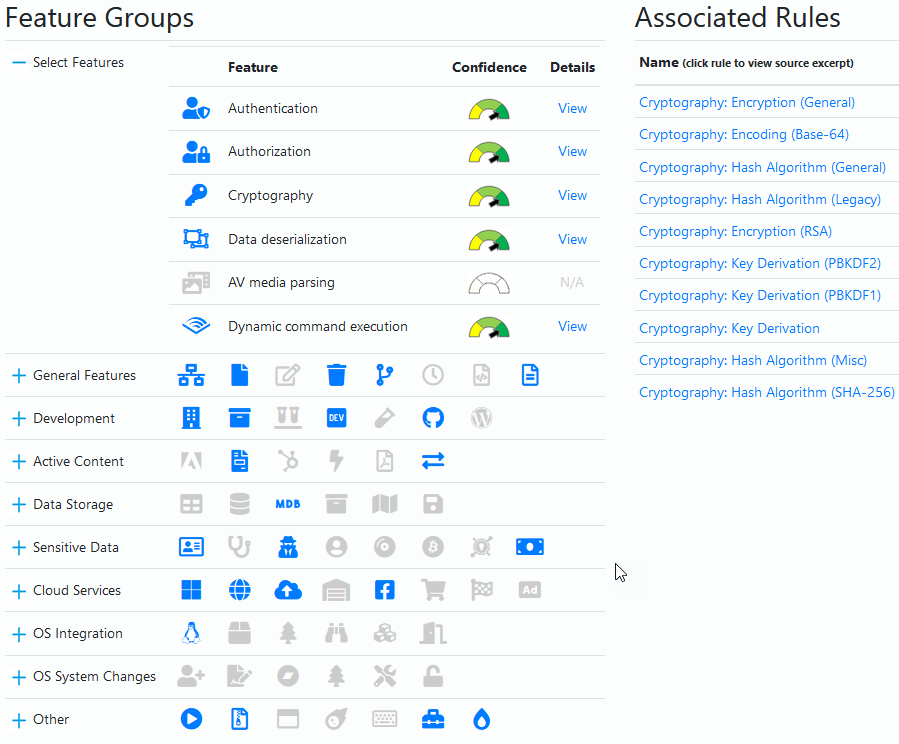
Application Inspector feature overview.
We can now drill down into each of these sections to find out more about the code. Similar to what we did in the Summary view.
I made a short gif to showcase the report exploration.
Drilling down into the Application Inspector data.
Summary and links
This was a short post about a tool I found very useful to digest the solutions and projects I am working with. Especially if you’re fresh coming into the project and have little to no insight into what’s being done, it can be a good eye-opener.
Read more:
- Introducing Microsoft Application Inspector (Microsoft Security)
Feel free to leave a comment. Thanks!

Comments are closed