
I love automation. Part of the glory of seeing a green build is to also know that it has passed some type of quality gates. In this post I’ll talk a bit about some of my favorite Code Analysis tools for .NET Core. I use them in both personal as well as work projects, in a varietal mix depending on project. It’s not an exhaustive list, and by no means the only tools that can be used. These are a select part of my arsenal to ensure I stay on the right path when developing software.
Someone asked me recently what tools I personally use to analyzer code for .NET Core and Azure. Here are the freely available, and low-hanging fruit options for you.
We can talk about a more exclusive list later, discussing some premium code analyzers and application vulnerability scanners - but that is for another day. Let’s dive in!
Why code analysis?
Software evolved quickly, both internally developed and third-party software. To stay up to date with all the frequent changes, we need to automate certain aspects of our development and operations work.
Continuously seeing an increase in code changes without understanding what those changes are doing, can quickly lead to possible bugs, application failures and vulnerabilities. These are risks at various levels - corporate data exposure risks, business continuity risks, delays in releases, and a lot more.
At the team, or organizational level, you can define a set of policies and rules that should apply to all the code your team(s) write and commit to your code repositories. This means that you can also centrally track, and approve or reject changes that will fly into your production workloads, depending on the quality report of a build.
There are a lot of great reasons why you want to use code analysis during development, but also in your build pipelines. Here’s a few examples that comes to top of mind.
In development:
- Inspect code, development-time. Using build-time code analysis in Visual Studio (or other preferred tool), we enable developers to quickly understand what rules are being broken. This enables them to fix code earlier in the development lifecycle, and we can avoid builds that fail later.
- Detect code vulnerabilities or code that may breach corporate policies or general best practices.
- Increase the efficiency, and strengthen the confidence of quality code produced.
In build pipelines:
- NuGet packaged analyzers are the easiest, and they will automatically run as your project builds on the build agents.
- Enforce code quality and best practices across developers.
- Reject code changes that introduce vulnerabilities, or code that introduces policy-breaking changes.
- Automate everything; When a build encounters a code quality error, you can immediately fail the build, send alerts, or apply any other actions you and your team needs.
- Help your operations-team to get insights into the quality of the delivery, before a major release.
Generally:
- You have the confidence to release more frequently.
- This results in having a quicker TTM (Time to Market).
- Reduce business risks (data loss, vulnerabilities, application failures, ..)
That said, code analysis isn’t something that magically makes your applications work like a greased machine all by itself. It should be considered as a helping hand, but in the end, you still need to ensure that the output of the code analysis reports are true, do not contain false positives, and that you get value to your organization and wider teams - not just use it as a number-driven report to show on a slide deck. Getting reports without taking action is like knowing the ship is sinking due to holes in the hull, but just looking at the holes or ignoring them, instead of helping repair them.
There are also often two types of code analysis commonly referred to. I will not dwell into the details, but here’s the gist of it:
- Static Code Analysis. Analyzes your source code files, but will not run your application. Some analyzers can also analyze compiled DLL’s, for example.
- Dynamic Code Analysis. Analyzes your application when it’s running, and detects how it’s acting. This is useful for testing how the app integrates with other components, which could be tricky to identify statically in the source code. Usually we see dynamic code analysis executed on build agents more often than from developer’s machines, as it requires input files, a test execution environment or application, and then you’ll need to analyze the output data.
Options to run code analysis
Most of the code analyzers I am talking about in this post are static analyzers. I might cover some of my favorite dynamic code analysis tools later. Now, let’s stick to the low-hanging fruit.
Code analysis from your development box
If the analyzers come with an extension for Visual Studio or Visual Studio Code, you can enable the developers to first-hand get insights into the coding practices that needs to be followed.
This does not come with a requirement to add any dependencies to your solutions and projects. Instead, the code analysis tools run from your developer box when you want them to. Most often when you build your code, or if it is a Linter, it runs as you type.
Code analysis using NuGet analyzers
With NuGet packaged analyzers, we can run them both a local developer boxes during local build, as well as in our build pipelines.
This creates a dependency on the NuGet analyzers in your projects, but comes with the convenience that regardless if you build locally or on a build agent, you get the same analyzers applied to the code base.
The entire team benefits here, as all code is passed through the same checks.
Code analysis with build pipelines / releases
With build pipelines we get a lot of automation. Having automation is great for this part of our work as well.
In my build pipelines I can easily ensure, and enforce, that a certain level of code correctness and code analysis runs and comes out with good quality before a build is flagged as successful.
We can run a lot more tools here than the NuGet analyzers, of course. We can run third party Application Vulnerability Scanners, and a lot more great tools to help us stay safer as we deploy more code.
Favorite code analysis tools for .NET Core
This post focuses on available analyzers that we can simply pull into our projects from NuGet or Visual Studio extensions.
These analyzers can prove to be useful when developing Azure solutions. In no particular order, these are my top picks:
AsyncFixer
This is one of my absolute favorites.
When you have complex solutions, or even simple solutions that depend on code outside of your comfort zone or knowledge, this tool is great for understanding where you could have potential thread blockers and other async-related issues.
Things it checks:
- Unnecessary async/await methods.
- Using long-running operations under Async methods.
- Fire-and-forget patterns.
- Implicit downcasting from Task
to Type
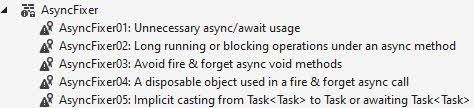
AsyncFixer code analysis tool for Visual Studio and NuGet.
It sounds simple enough, right? Small modifications have had a great impact on my cloud-native applications, such as:
- Azure Functions async improvements, reducing thread exhaustion.
- Azure Container Instances, with a similar result as for Functions.
- Web apps, where there were some unwanted async issues, reduced unexpected application hiccups.
- Minimized thread-exhaustion. This is a real problem, especially if you build internet-scale type of software. (Read more in a good SO thread: https://stackoverflow.com/questions/57611394/does-using-async-await-avoid-thread-exhaustion)
Granted, this tool haven’t been updated in a while, and there might be new analyzers available to help mitigate some of the async issues your code can introduce.
Available as:
- AsyncFixer (NuGet)
- AsyncFixer (Visual Studio Marketplace)
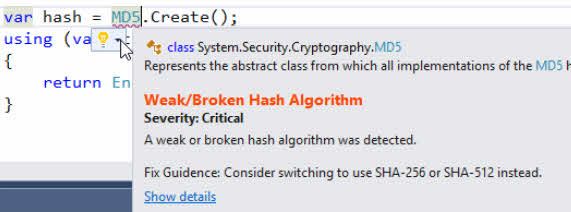
SecurityCodeScan
The SecurityCodeScan is a Roslyn analyzer that specifically checks for vulnerabilities in your C# code.
It checks around 40 code rules right now:
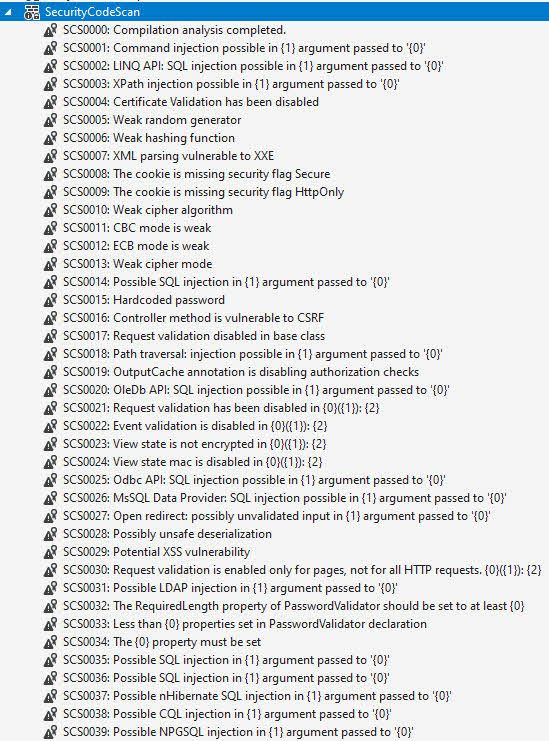
SecurityCodeScan NuGet Roslyn Analyzer offers around 40 rules to check for code vulnerabilities in .NET
What I like about this extension is that it has a good amount of checks specifically targeting common coding mistakes related to Security.
Again, this could be more up to date. However, to get started, this is a great set of rules to check your code for.
Available as:
- SecurityCodeScan (NuGet)
- Security Code Scan (Visual Studio Marketplace)
DevSkim
Microsoft has a great tool called DevSkim, which is basically a Linter that helps you with security-related coding practices.
There is a repository under Microsoft/DevSkim on GitHub, where most of the information is available or linked.
Microsoft DevSkim to help secure your code.
Available as:
- Microsoft.CST.DevSkim (NuGet)
- DevSkim for VS 2019 (Visual Studio Marketplace)
- DevSkim for VS Code (Visual Studio Code marketplace)
Credential Scanner, CredScan
Microsoft have a Credential Scanner as part of their MSCA toolset, which I’ve talked about previously here.
- Scans your code repository for commonly known key and credential patterns.
- Helps to keep the code clean from accidental token- and credential exposure.
- Reminds me of the built-in capabilities that GitHub have for token security scans, to help repositories stay clean(er).
Available only with the Microsoft Security Code Analysis extension toolset for Azure DevOps. Learn more about it here, and how to onboard:
Roslynator
This is an exhaustive set of rules. Today, it contains more than 500+ analyzers, refactorings and fixes for C#.
I find it useful when I need to improve my coding style, help with correctness or generally find how I can write code better and smarter. It can result in “alert fatigue” in the sense that you can get a lot of warnings for things you may not care about, which is why the ignore options are important to master.
Available as:
- Roslynator 2019 (Visual Studio Marketplace)
- Roslynator (Visual Studio Code Marketplace)
- Roslynator.Analyzers (NuGet)
More info on the author’s website: http://pihrt.net/Roslynator
SonarLint and SonarAnalyzer
SonarLint is a linter and SonarAnalyzer is a code analyzer, spotting bugs and quality issues during development as you type the code or during build (analyzer). It helps you with a set of different categories that I particularly like:
- Security Hotspot
- Vulnerability
- Bug
- Code Smell
List of rules for C#:
The website is fairly comprehensive and gives you great insights into what languages, categories and types of checks are offered. You can easily see, as an example, all the security-related checks for C# easily:
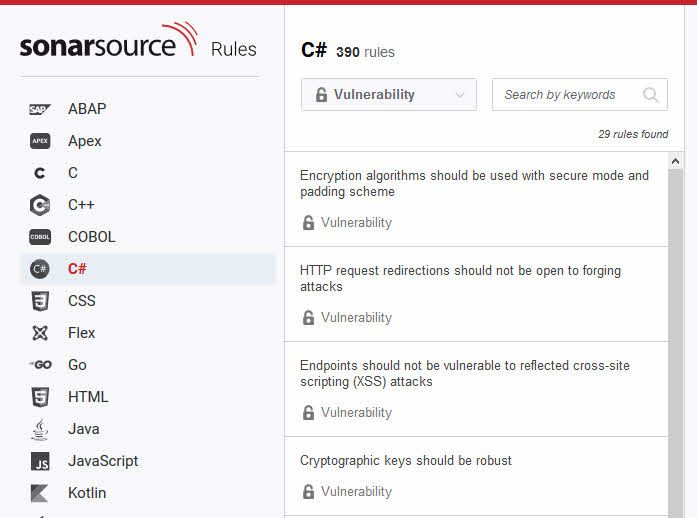
SonarSource CSharp rules. Showing vulnerability rules.
Available as:
- SonarSource.SonarLint for Visual Studio 2019 (Visual Studio Marketplace)
- SonarSource.SonarLint (Visual Studio Code Marketplace)
- SonarAnalyzer.CSharp (NuGet)
Honorary mentions
Without getting into more details, here is a list of additional analyzers that you may or may not want to check out. Some might not have been updated for a long time.
RefactoringEssentials
FxCopAnalyzers
Summary
As far as analyzers (and linters) go, the ones listed here are some of my favorites. I use them in various combinations, but the list can be made a lot longer with more analyzers available from other third-party vendors and from Microsoft, and open source initiatives.
I should give an honorary mention to StyleCop and analyzers for proper formatting. They are definitely an important aspect for code consistency and keeping an adequate level of code posture in distributed teams, too.
Key takeaways:
- This post outlines my personal favorites.
- I talk more about code analysis than code formatting. Both are important, but security and reliability comes first I need to make tradeoffs.
- The options for analyzing source code are many. Get comfortable with the ones that fit your case best, or select multiple analyzers for a single project.
- Running any analysis is better than not running analysis at all.
Until next time, take care. Feel free to leave a comment, I’d appreciate that.
Header photo by Adeolu Eletu on Unsplash
Comments are closed