A powerful capability of the Azure Sentinel service is that you can ingest data from a wide variety of sources. Using Connectors, you can even ingest data from other places than Azure, and you can get a more complete picture of your security posture across services in your technological landscape.
In a previous post I talked about how to ingest Office 365 logs into your Azure Sentinel dashboards. In this post, I’m talking about how we can build our own Azure Log Analytics Data Collector API application to send custom logs to your Log Analytics workspace - and since I’m sending it to the same LAW (Log Analytics Workspace) as my Azure Sentinel service is using, I will be able to set up a new dashboard there to monitor this data as well.
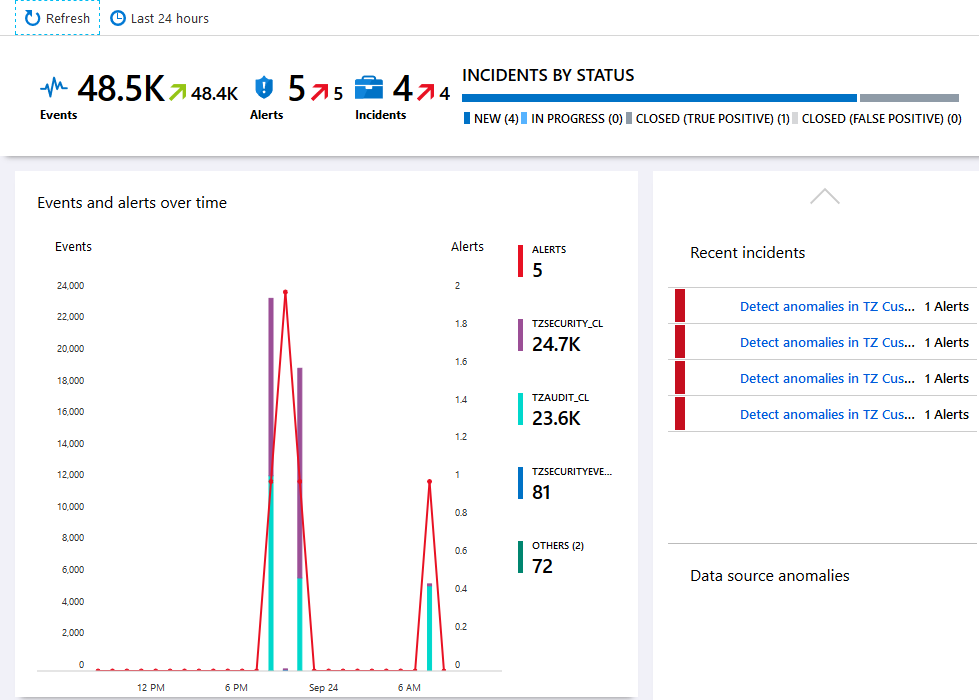
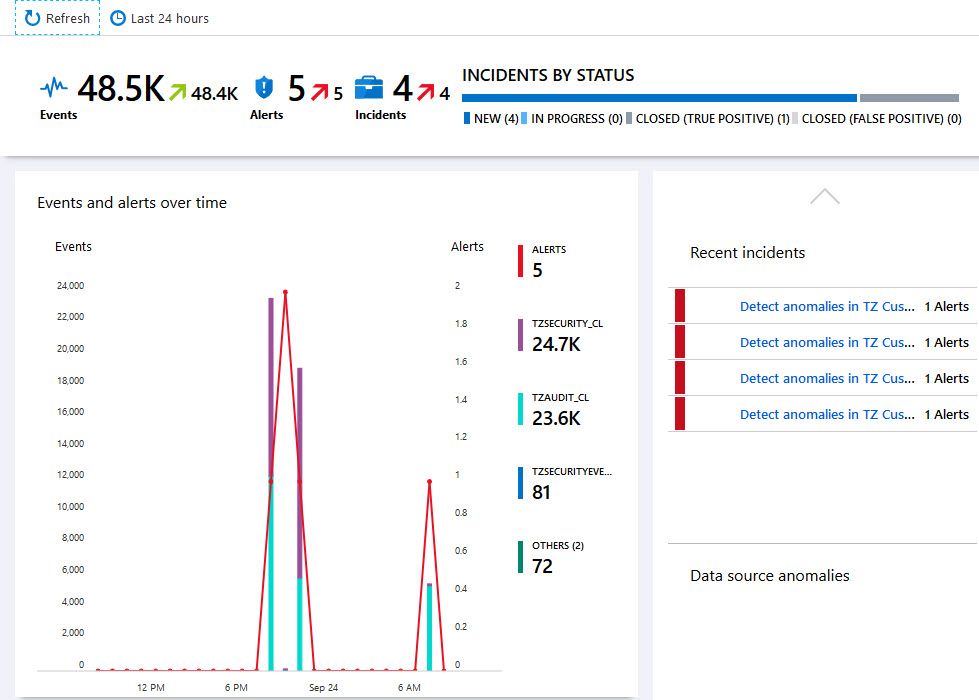
Azure Sentinel displaying custom events ingested from Azure Log Analytics
The Story
You have a lot of applications. Azure services and solutions, third party software and services and a plethora of custom applications your business is building and maintaining - there’s applications, micro services, monoliths, web apps, backend services, functions, containers, you name it - I think you get the point.
Usually there’s a wide range of locations where these things are being logged, instead of a single central place. This is absolutely no problem, and with Azure Sentinel we can ingest logs from other places, or use the underlying Azure Log Analytics engine to pull out logs automatically.
The purpose of this article is to showcase the scenario and capabilities of building your own applications, send logs to Azure Log Analytics and ingest them in Azure Sentinel for security review and auditing, and to be able to effortlessly create rules and alerts around critical events which creates incidents in the system automatically.
With the stage set, we just need to prepare before we start the journey. Tag along to learn how to build a truly scalable and smart detection system for your custom applications.
Cost and billing awareness
Sentinel pricing
The pricing details of Azure Sentinel was made available with the launch of General Availability (GA), on September 24th 2019.
There’s two available models:
- Capacity Reservation - Fixed fee and predictable cost.
- Pay-as-you-Go - Pay for the data ingested and data retention, which is based on Azure Log Analytics.
See the links below for additional insights into the costs.
Log Analytics pricing
Remember that the pricing of Azure Monitor is based on this:
- Data Ingestion (Amount of GB sent to Log Analytics)
- Data Retention (Amount of GB you store over a period of time, after 31 days - the first 30 days are free)
That said, the price per GB is cheap and you need to send quite the amount of data to hit huge bills. Over time, it can accumulate quite a bit, but then it’s usually worth it from the business perspective.
I’m mentioning this mostly from a solution architecture point of view. When we now design our own entities to send over to the logs, you should really consider what goes into each entity, and perhaps think twice about what information you really need to ship to the logs.
With a pre-built connector, you usually get what you get - but when you build your own applications that are designed around your own requirements, you can make deliberate choices that has an impact on data ingestion and retention. 💪
Custom Log Analytics Data collectors with C# .NET Core
In order to kick this off, we need to grab the connection details to our Log Analytics. We can do this easily from the Azure Portal like this.
Go to your Azure Log Analytics Workspace - “Advanced Settings” - “Connected Sources” - “Windows Servers” (or what is applicable to you), and grab the following details:
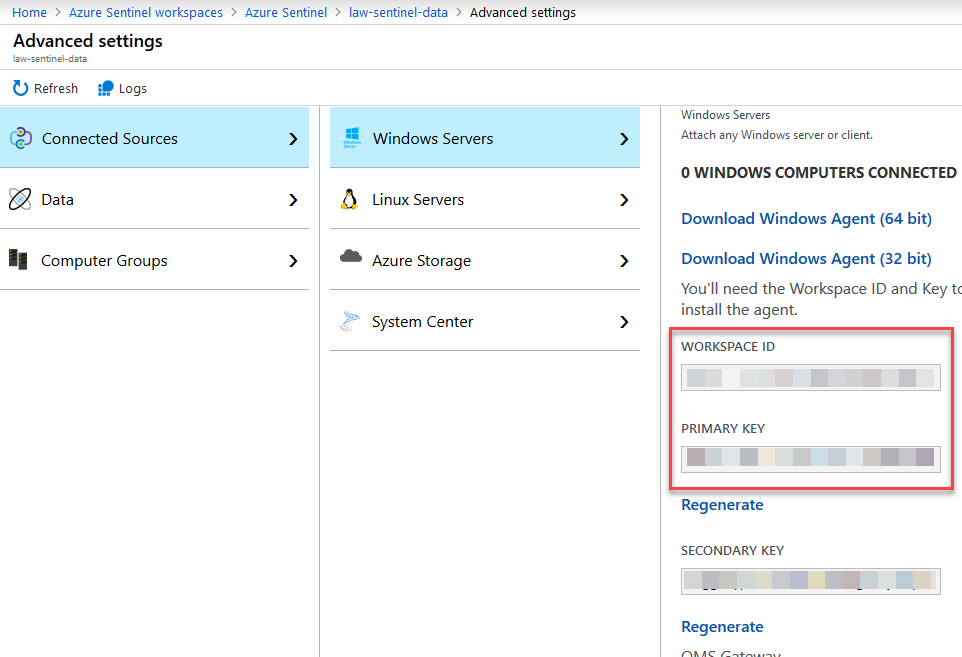
Azure Log Analytics Connection Details
Make a note of these values, as we’ll need them from the sample code below.
With that out of the way, I have previously blogged about building a .NET Core (C#) Log Analytics Data Collector wrapper to demonstrate how the code works:
With this post, I’ve updated the code samples on GitHub, and they are available here:
Example of what the REST query to Log Analytics can look like:
public void SendLogEntries<T>(List<T> entities, string logType)
{
    #region Argument validation

    if (entities == null)
        throw new NullReferenceException("parameter 'entities' cannot be null");

    if (logType.Length>100)
        throw new ArgumentOutOfRangeException(nameof(logType), logType.Length, "The size limit for this parameter is 100 characters.");

    if(!IsAlphaOnly(logType))
        throw new ArgumentOutOfRangeException(nameof(logType), logType, "Log-Type can only contain alpha characters. It does not support numerics or special characters.");

    foreach (var entity in entities)
        ValidatePropertyTypes(entity);

    #endregion

    var dateTimeNow = DateTime.UtcNow.ToString("r");

    var entityAsJson = JsonConvert.SerializeObject(entities);
    var authSignature = GetAuthSignature(entityAsJson, dateTimeNow);

    HttpClient client = new HttpClient();

    client.DefaultRequestHeaders.Add("Authorization", authSignature);
    client.DefaultRequestHeaders.Add("Log-Type", logType);
    client.DefaultRequestHeaders.Add("Accept", "application/json");
    client.DefaultRequestHeaders.Add("x-ms-date", dateTimeNow);
    client.DefaultRequestHeaders.Add("time-generated-field", ""); // if we want to extend this in the future to support custom date fields from the entity etc.

    HttpContent httpContent = new StringContent(entityAsJson, Encoding.UTF8);
    httpContent.Headers.ContentType = new MediaTypeHeaderValue("application/json");
    HttpResponseMessage response = client.PostAsync(new Uri(RequestBaseUrl), httpContent).Result;

    HttpContent responseContent = response.Content;
    string result = responseContent.ReadAsStringAsync().Result;
    // helpful todo: if you want to return the data, this might be a good place to start working with it...
}
Calling the methods can be easily done like this (populating demo security events only):
LogAnalyticsWrapper logger = new LogAnalyticsWrapper(
    workspaceId: workspaceId,
    sharedKey: sharedKey);

// SECURITY EVENTS (Sample/Demo code only)
List<TZSecurityEvent> securityEntities = new List<TZSecurityEvent>();
int securityRandom = new Random().Next(100, 12000); // amount of randomized log events to ship.
for (int ii = 0; ii < securityRandom; ii++)
{
    securityEntities.Add(new TZSecurityEvent
    {
        Severity = GetSeverity(DateTime.UtcNow.Millisecond),
        Source = Environment.MachineName,
        Message = GetRandomMessageForTest(DateTime.UtcNow.Millisecond)
    });
}

logger.SendLogEntries(securityEntities, "tzsecurity");
With that said, I am not re-iterating the entire code base in this article - just head on over to GitHub and grab the code, and adjust as you see fit in your business scenarios. Please be aware that the code is for demo-purposes only, and you should integrate it into your organization with a critical eye and adjust it according to your coding standards and security guidelines.
WorkspaceId and SharedKey should NEVER be in your source code. Use a Key Vault, and if you can, use Managed Identities to access it to completely avoid credentials in code, config or infrastructure. In this demo, we don’t cater for that.
Working with our data in an Azure Log Analytics Workspace
At this point I have build my custom connectors. If you missed that part, the links are in the previous section where all of the source code is available.
Now I want to make sure that I can actually see my custom logs in Azure Log Analytics before I do anything else.
Review and ensure that our logs are ingested into Log Analytics
Heading on over to the Azure Log Analytics workspace and firing up the query window gives us a chance to keep an eye out for our custom events. Let’s take a look:
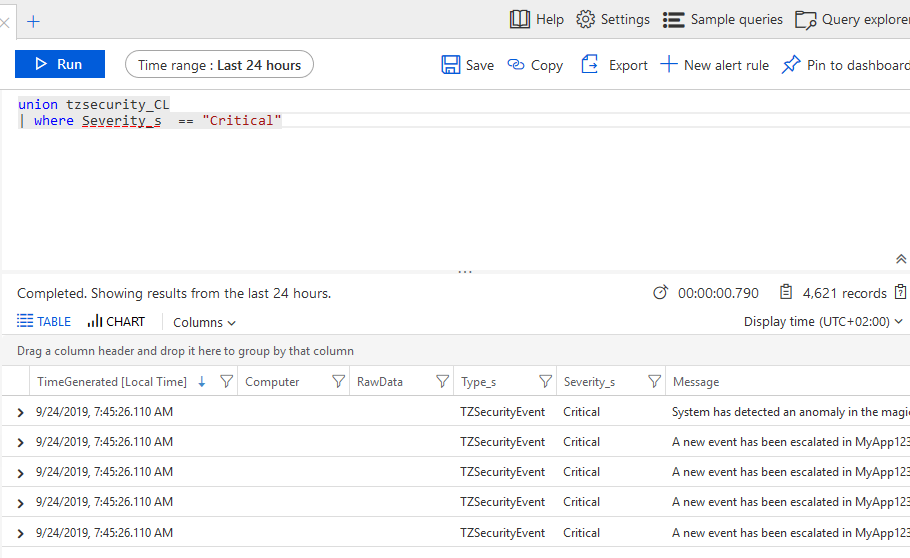
Azure Log Analytics contains the custom security events from our appliation.
I’m listing Critical event in the “tzsecurity_CL” table, where my custom security events reside.
Make a note of the query, as you’ll need it further down in Azure Sentinel when configuring your Sentinel rules.
Integrating with Azure Sentinel
In my post I’ve focused on how to send custom logs to an Azure Log Analytics workspace. Since Azure Sentinel is using a Log Analytics workspace behind the scenes for data ingestion and its operations, it’s super easy to ingest this data - from my application I’m sending the logs to the same LAW (Log Analytics Workspace) as the Azure Sentinel service is tied to.
If the logs are populated with new entities, you can start working with it from the Azure Sentinel dashboards and rules.
Next, we’ll take a look at:
- Dashboards in Azure Sentinel now contains our custom log data
- We will define custom Rules
- We will review incidents which are now automatically created for us by Sentinel
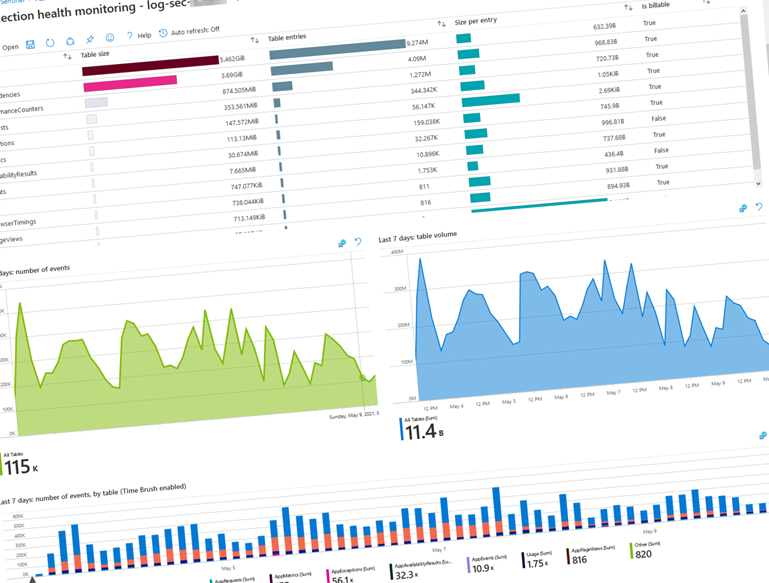
Review initial data in the default dashboard
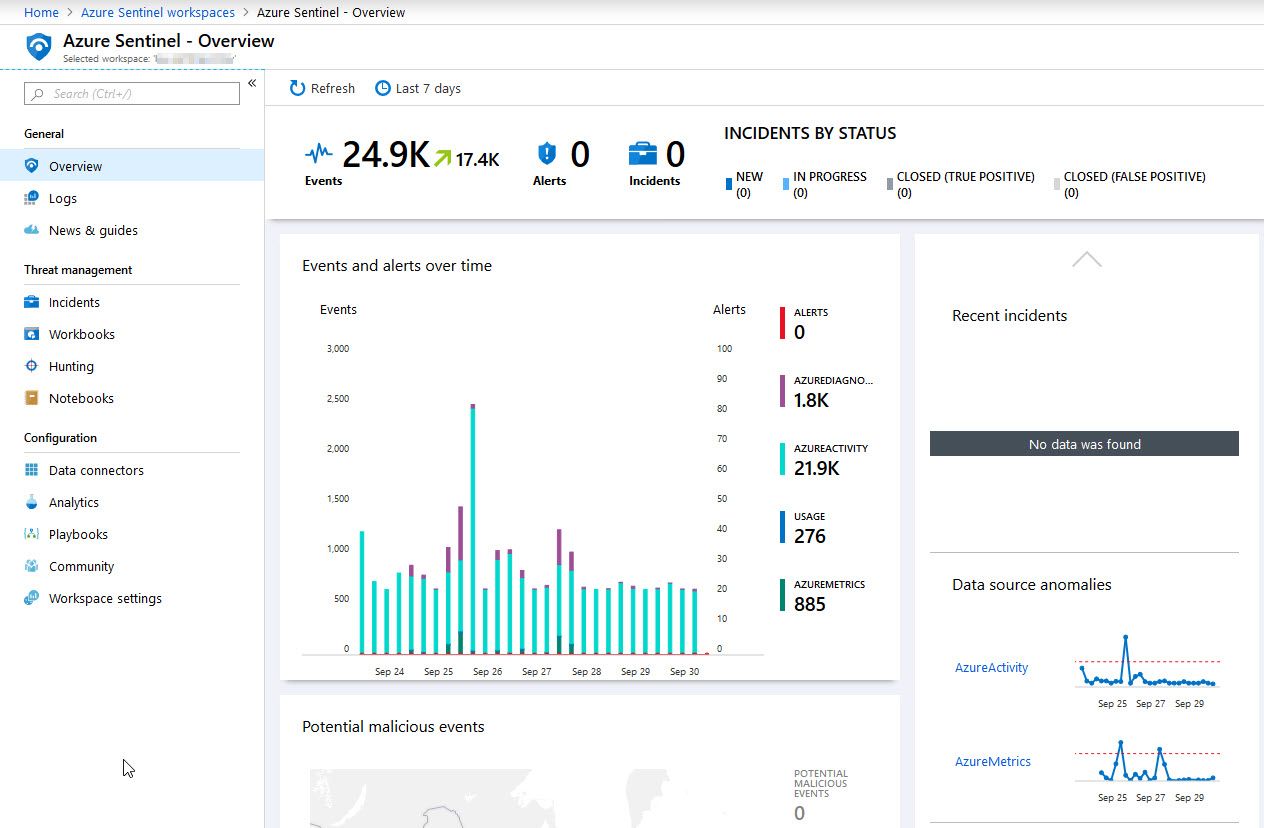
If things have been configured properly, and some data has been ingested to Log Analytics, it should start to fill up the default dashboard in Azure Sentinel. Here’s my dashboard after a while - since it’s a protected single-user environment, there’s not a lot of other events going on than the ones I caused for this demo, but the data is there and it works flawlessly.
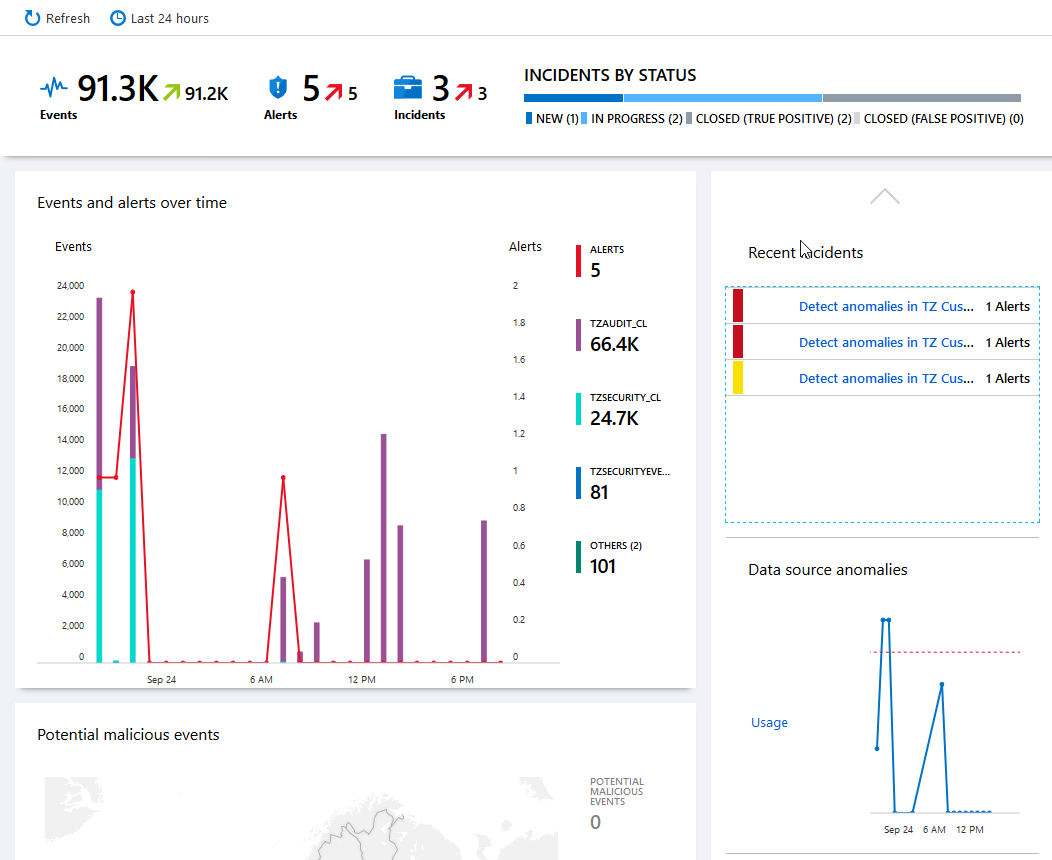
Azure Sentinel has ingested the data from the Log Analytics Workspace.
Great, the dashboard works and our data is successfully integrating with Sentinal. We can start benefitting from the smartness of Azure Sentinel.
Create a new Rule Template for any custom events
At this point, I want to create new rules that aligns with data that my logs are processing. In Azure Sentinel, go to “Analytics” and “Rules”. Click ”+ Create”:
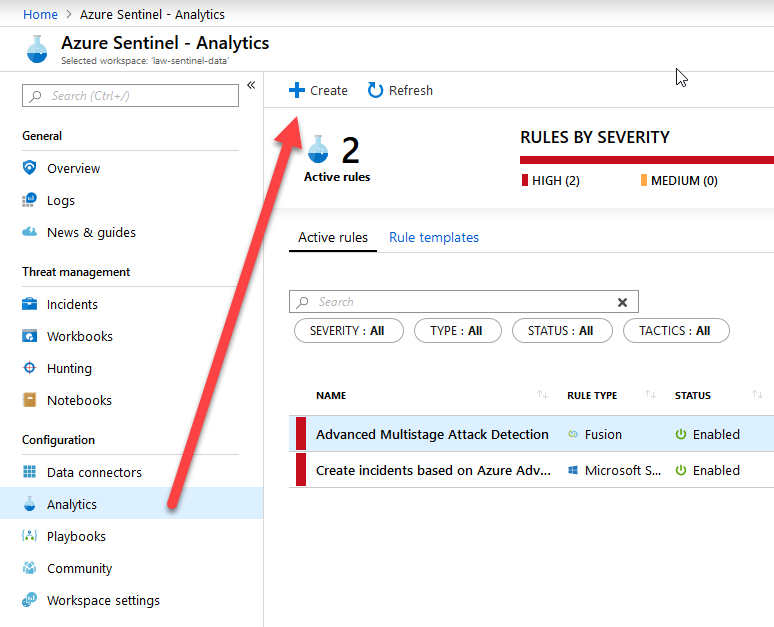
Azure Sentinel from the Azure Portal, creating a new Alert Rule Template
Fill in the desired metadata about your new Rule:
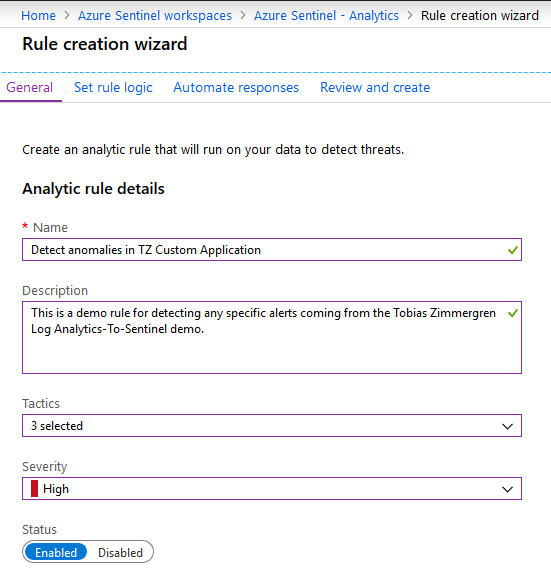
Azure Sentinel and custom rule definition from the Azure Portal.
Move on to the “Set rule logic” tab and define your logic here. In my case I’ve defined this query and configuration, which I’ll explain below the picture:
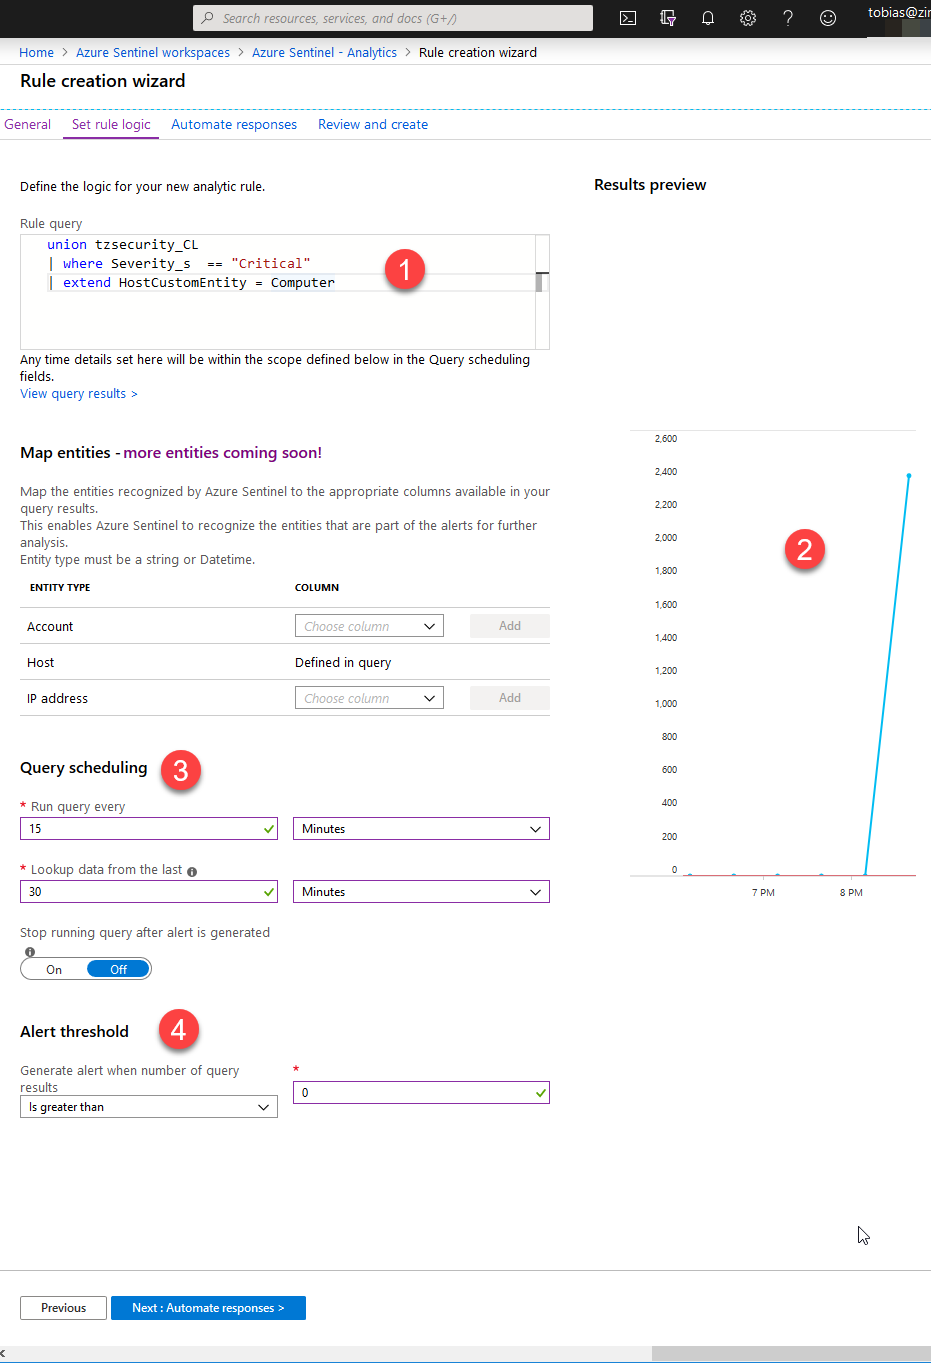
Azure Log Analytics and Azure Sentinel Rule that triggers when Critical Security Events from Custom Applications happen.
In the above picture, this is what’s happening:
- Search for all items in the “tzsecurity_CL” table, where the Severity is “Critical”.
- If there’s any alerts in the pipe already, it should display this in the chart. In my case it’s fairly empty right now.
- Define the rule checking cadence. I’m aiming for checking Every 15 Minutes and I’m looking back 30 minutes to see if the conditions match.
- The conditions are defined here. I am looking for More Than 0 entries, so given the chart we noticed in the picture, I should get plenty of alerts if that trend continues.
My actual log query is:
union tzsecurity_CL
| where Severity_s  == "Critical"
| extend HostCustomEntity = Computer
Next up, you can click “Automate Responses” if you need to automate using any Azure Playbooks. I am skipping this for now, as I think it falls slightly outside the scope of this post.
Hit “Review and Create” and you should see a summary, and hopefully that “Validation passed”:
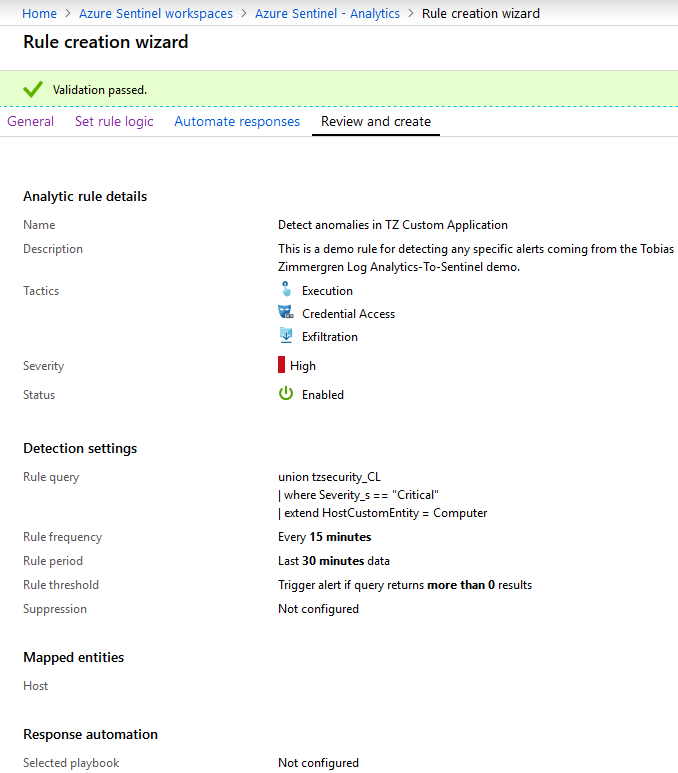
Azure Sentinel Rule summary and review before creation.
Click “Create”. Done!
If everything is configured successfully, it should show up under the “Active rules” tab and show the metadata:
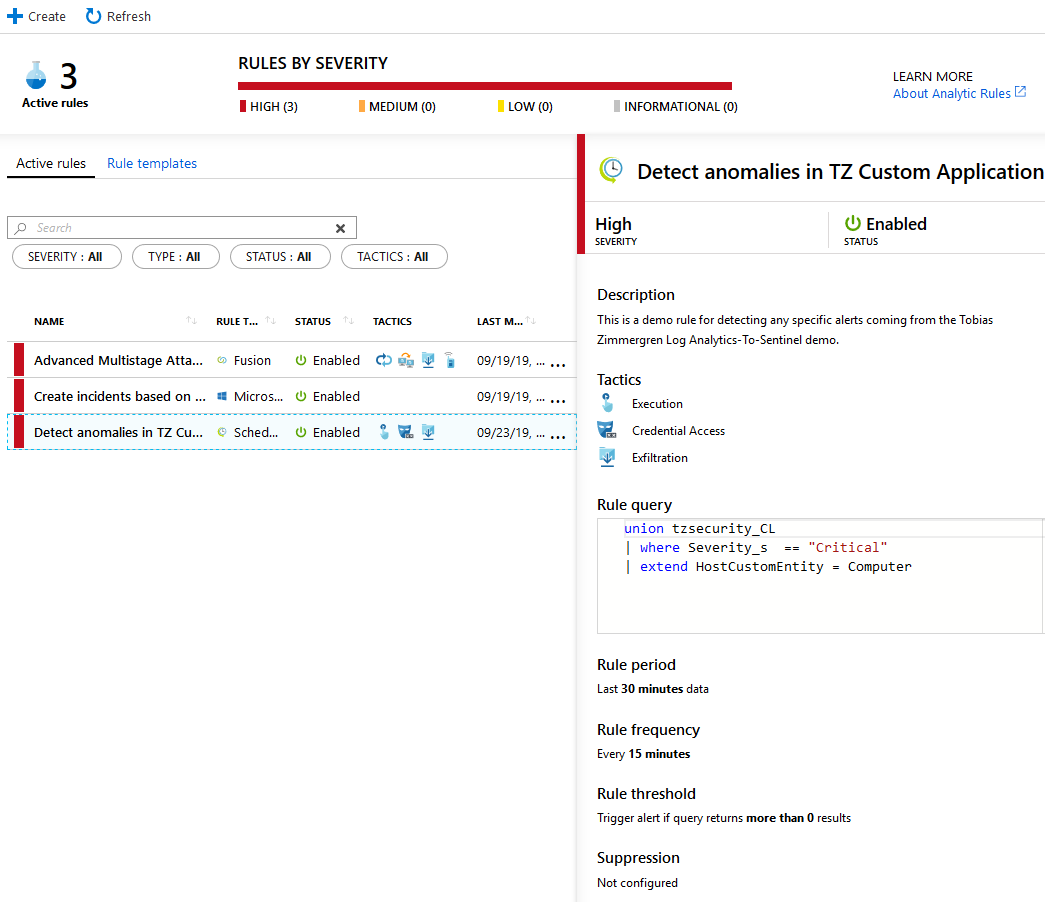
Azure Sentinel custom rule showing the metadata properties.
To really test that it works, head on over to “Incidents” and see if there’s something showing up. My first incident has showed up and I can click it and see the details. It’s fairly empty right now, but I can see the basic details and then take action from there.
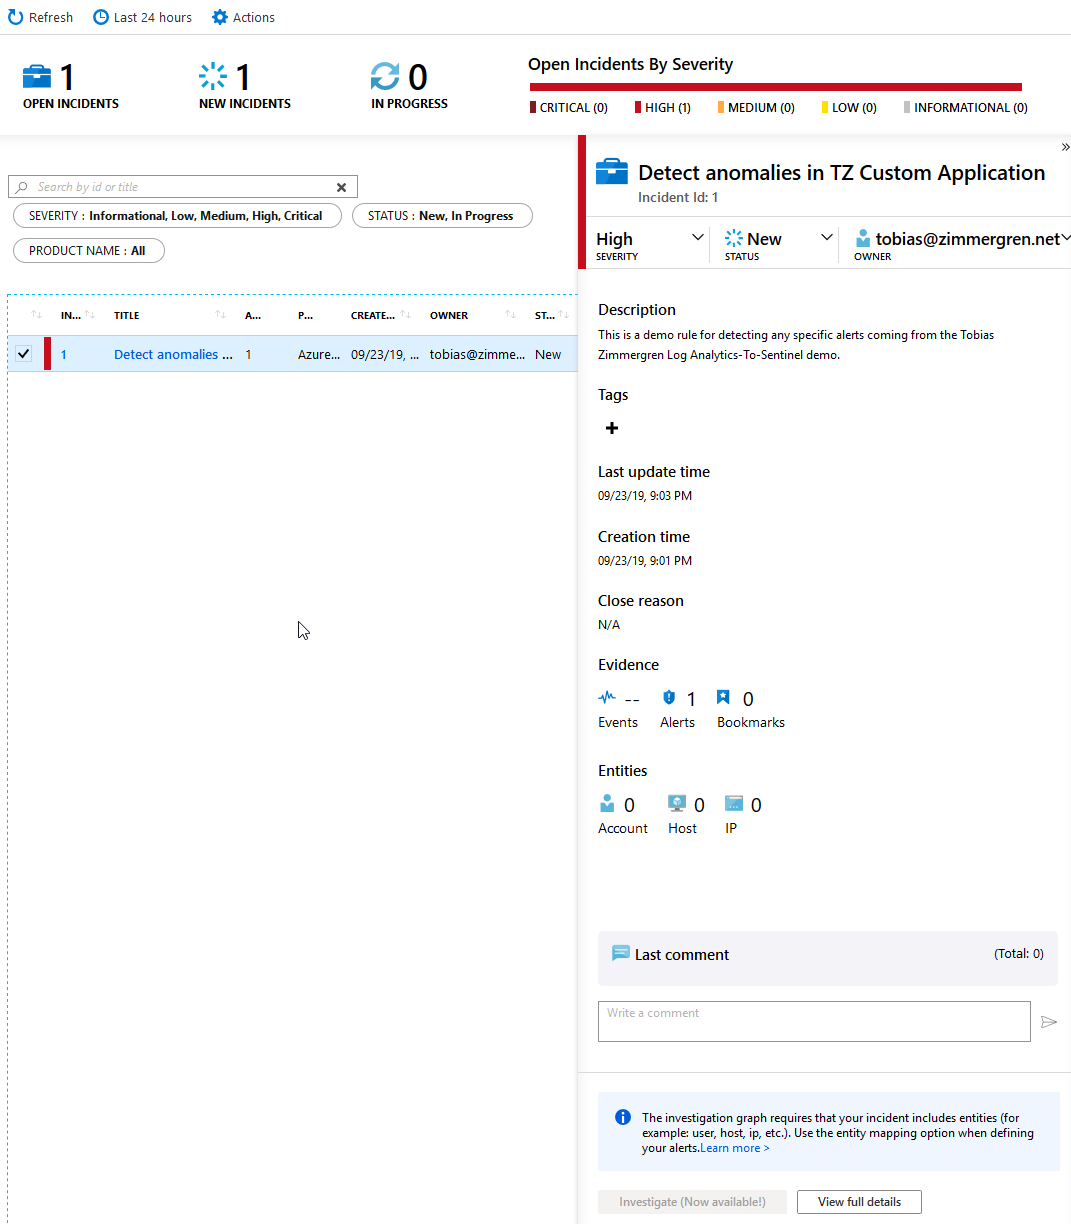
Azure Sentinel Incident based on Custom Application Logs sent to an Azure Log Analytics Workspace
There we have it, the integration works all the way. There’s truly a lot of capabilities with this, and there’s a lot of cloud power to help you strengthen your security posture both on the infrastructure and code side of your business.
Summary
That’s a wrap - we have successfully achieved what we wanted, which is:
Business Scenario.
- Custom applications are logging security events
- Log Analytics are logging the data and making it queryable
- Azure Sentinel ingest data from Log Analytics and we can now start working with the full feature set of the Azure Sentinel service
- Defined set of rules to look out for in our custom logs
- Incidents are created and reported on, when a rule is triggered
The technical implementation, which is very straight forward.
- Any of our business applications now generate some type of authorization failure, authentication failure, or other security related information we really need to log
- .NET Core code sends logs using C# to Azure Log Analytics
Recommended links
Source code
- GitHub: Source code for the demos.
More recommended reading
Comments are closed