Getting insights into the resources we operate is a crucial part of understanding where we need to improve and what works well. In reality, the insights and telemetry we gather exist in various regions and datacenters. Data sits in multiple subscriptions and different resource groups - even the same application can have numerous Application Insights instances, depending on what type of data and how much we collect.
When I want to aggregate and query the logs from various Application Insights instances, I can use KQL in the log query.
For example, a distributed set of applications report telemetry in different regions, and various parts of the solution send data to other application insights instances. However, I want to troubleshoot why the performance was slow in the solution across multiple regions - and various parts of the micro-service architecture.
Wading through multiple different Application Insights apps to get the complete picture will not be a task for the faint of heart. Instead, let’s unify the data in our queries.
Note!
For this to work, your Application Insights need to be using the Workspace-based resource mode.Read about that here: Upgrade Application Insights to Workspace-based resource mode
Tag along!
Get your App Insights Workspace ID
When we want to roll up data from multiple workspaces, the first item on the agenda is to identify the Log Analytics Workspaces we wish to query.
Performing a cross-resource query can only be done if you have Upgraded Application Insights to Workspace-based resource mode or created it with a Workspace at creation-time.
The easy way to figure out the Workspace ID for any given Log Analytics Workspace is to go into the Azure Portal and select your Log Analytics service associated with the Application Insights service. From there, you see the Properties and the Workspace ID.
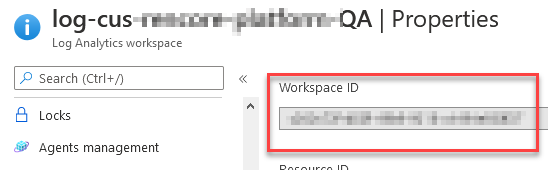
Workspace ID for the Log Analytics workspace used with our Application Insights.
Of course, you can also query the resources using something like the Azure Graph and grab the IDs that way.
Querying by other means than the ID is also possible, as Microsoft lists in their post for Identifying workspace resources.
Check the above link to understand how you can query by:
- Resource Name:
workspace("log-my-workspace") - Qualified name/full name:
workspace("subscriptionName/resourceGroup/componentName") - Workspace ID:
workspace("GUID")(this is what I’ll be doing) - Azure Resource ID:
workspace("/subscriptions/GUID/resourceGroups/rg-weu-myResourceGroup/providers/Microsoft.OperationalInsights/workspaces/log-my-workspace")
Query data from multiple Application Insight instances
I have multiple distributed applications: containers, Functions, Web Apps, and more glue in between. I want to roll up all the data into a single view or a set of queries, where I can easily have the team take a look when something strange is afoot.
Let’s take a look at a few basic examples to see how we can get our data. Since we’ve migrated the App Insights to the new Workspace-based resource mode, we can use the union Kusto keyword to aggregate data. This keyword helps to pull data from multiple Log Analytics workspaces, where our App Insight data is.
Use Azure Monitor to build the queries
From the Azure Portal, head over to the Azure Monitor. In Azure Monitor, you will see the “Logs” menu item.
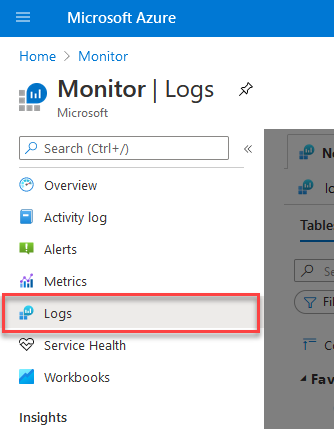
Azure Monitor - Querying Logs from multiple App Insights
Get all trace events with a Severity of 2 or higher.
Just as an example, I want to pull data from two of my workspaces. Specifically, I’m targeting the AppTraces, where I am logging various details from my apps.
union
    workspace("467e4054-e5ff-4940-8603-9e1578472ccb").AppTraces,
    workspace("8f99ecbb-b5df-4e02-acee-0d40d719a3b2").AppTraces
| where TimeGenerated > now() - 30m
| where SeverityLevel > 1
| project TimeGenerated, AppRoleName, Message, SeverityLevel
| order by TimeGenerated desc
In this example, I am querying two of my workspaces for their AppTraces logs, which contain any traces I’ve sent to App Insights.
I’m adding a few filters to query in the last 30 minutes, only get SeverityLevel 2 or higher, selecting the fields I want to return, and ordering them by creation time.
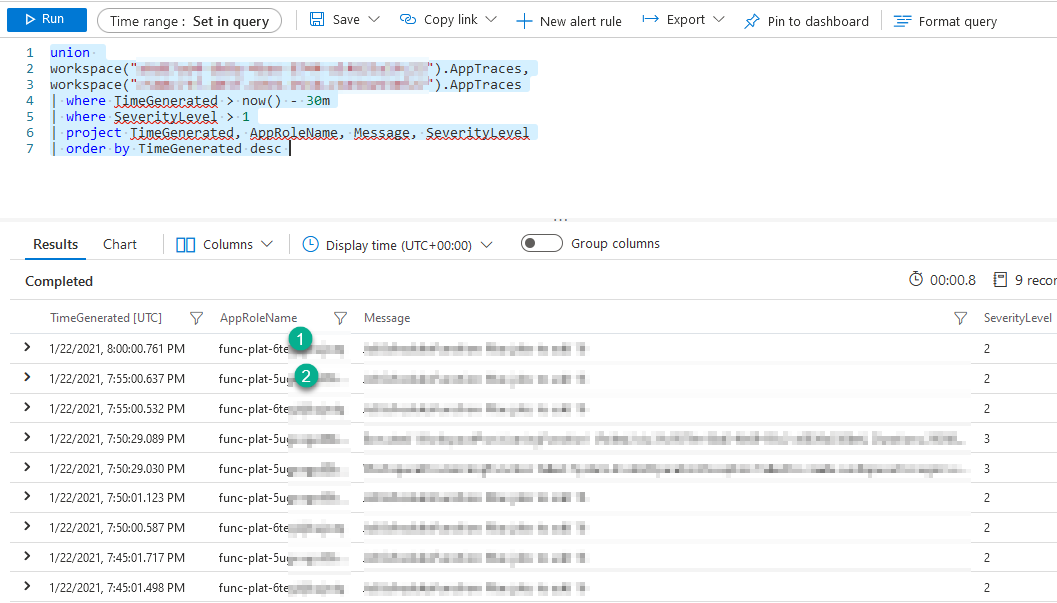
Multiple Application Insights with their Log Analytics workspaces being queries from Azure Monitor.
We can see that the last 30 minutes’ results contain traces from both my App Insight instances. In this case, a couple of my Functions have sent trace messages.
I have successfully rolled up all traces, from all my workloads, into a single view.
Learn from the built-in queries
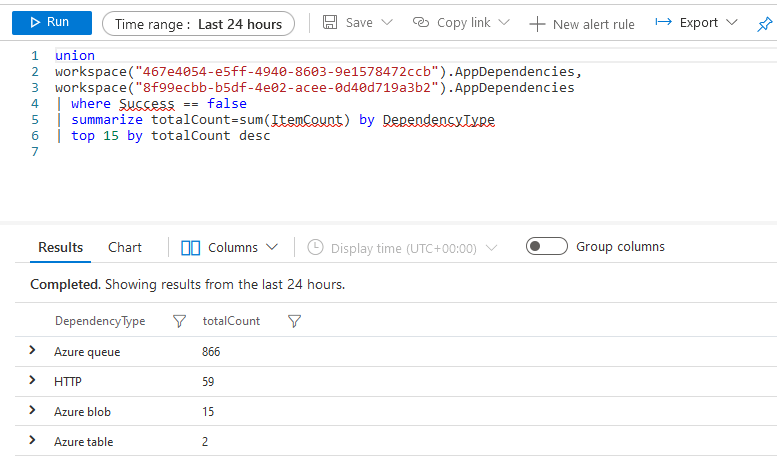
With Azure Monitor, you get a great deal of pre-defined queries to help you on your journey. We can easily take any of these and modify the queries to pull data from multiple workspaces. Here’s an example.
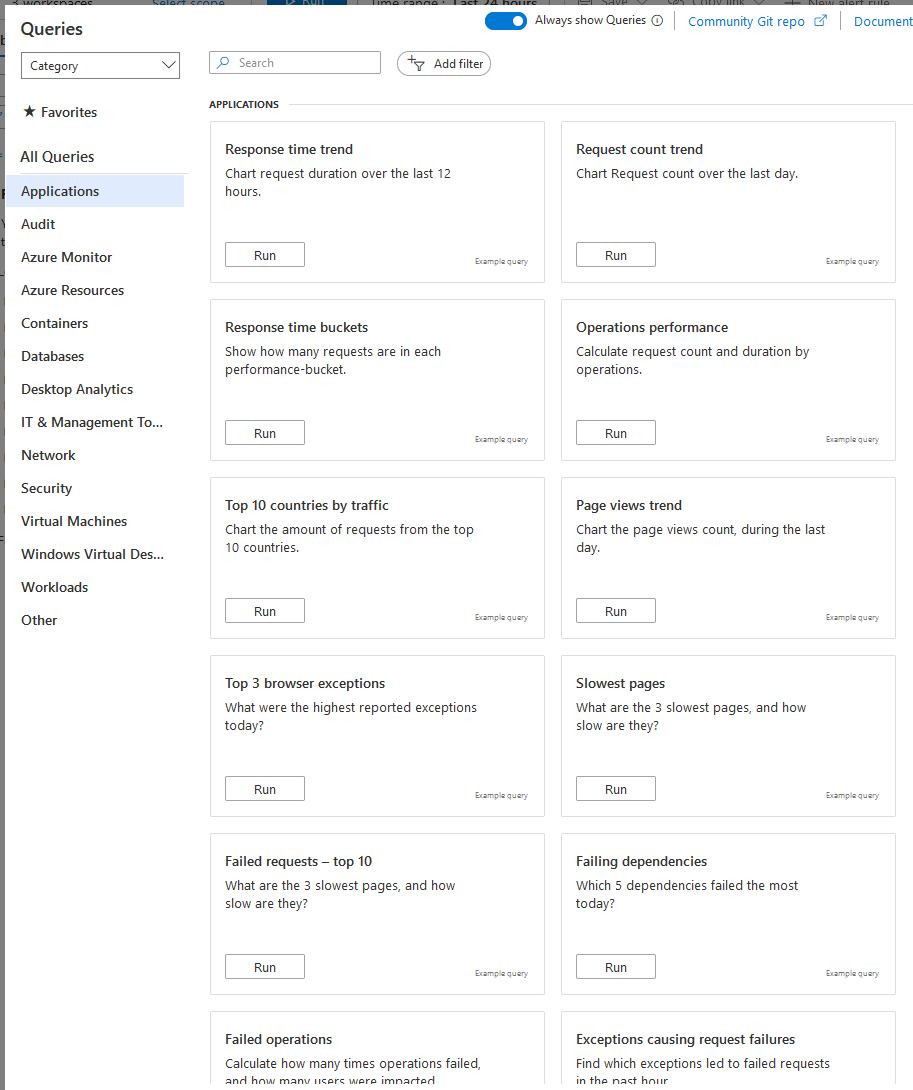
Azure Monitor built-in queries for Applications.
We can access these queries by navigating to Azure Monitor -> Logs.
If we want to start with one of these queries, we can select “Run” and see what data we get back, and then begin modifying to fit our requirements.
I am selecting the “Failed operations” to try. The below code is what the baked-in query looks like:
AppRequests
| where Success == false
| summarize failedCount=sum(ItemCount), impactedUsers=dcount(UserId) by OperationName, _ResourceId
| order by failedCount desc
We see our query results, and we can flip over to the “Chart” mode to visually render it.
However, I haven’t defined that I want to query multiple workspaces yet. I can do it in the UI, pick the “Select scope,” or do it in the query as I will do here.
Let’s change the query to pull data from all the workspaces I want - I’m doing it with the evident approach for demonstration purposes, using the Workspace ID:
union
    workspace('70ede73e-6ac9-4e48-9ae6-625f609713ad').AppRequests,
    workspace('de447fbc-26a3-4907-8431-64ee41fd6847').AppRequests,
    workspace('713e02db-df07-49bb-9dc3-f1c9daee5de4').AppRequests,
    workspace('ea6b1ec4-f6e1-42c9-8427-1afbde422fd8').AppRequests,
    workspace('e0f21359-bb10-42f9-8c02-00cc67dc913f').AppRequests
| where Success == false
| summarize failedCount=sum(ItemCount), impactedUsers=dcount(UserId) by OperationName, _ResourceId
| order by failedCount desc
Microsoft have some good docs about how to specify the workspace() parameter. Read the Identifying workspace resources.
Using the “Chart” tab to visualize our queries, we can more easily see across all resources where we are suffering.
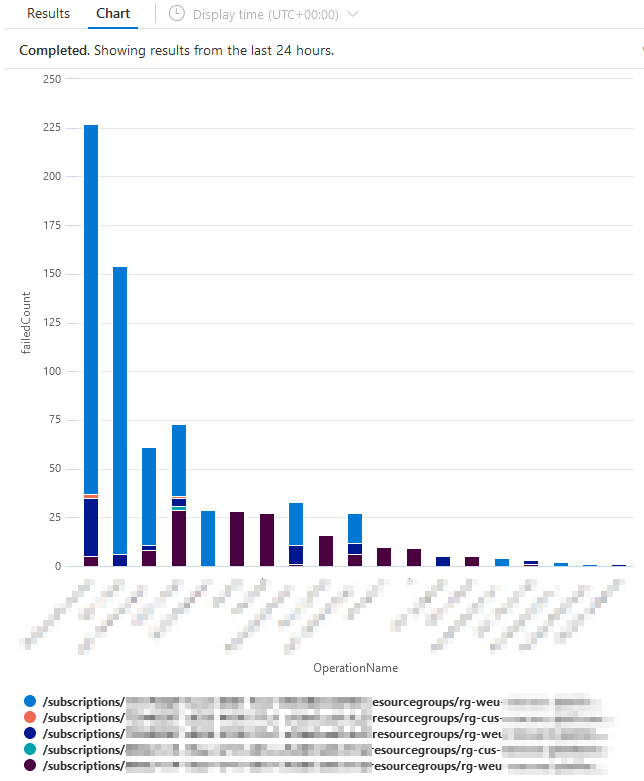
Azure Monitor rendering a chart for our Application insights operational issues, rolled up from multiple workspaces in Log Analytics.
I can see that all my five subscriptions are returning data. They are all part of the deployment picture and offer different essential elements of the solution. Now I can start figuring out if the issues are intermittent, mostly relates to a single instance of my services, are equally distributed across the ecosystem, and more.
Telemetry is crucial, and this is another way to create insightful queries and dashboards that I can now come back to see how regularly, and if, the fixes we implement are having any effect.
Summary
Application Insights and Log Analytics gives us a lot of powerful insights. Granular queries, cross-resource and cross-subscription queries are helpful to understand what’s going on in our systems.
In this post, we took a quick tour around how to query data from multiple Application Insights and the fact that they need to migrate to the Workspace-based resource mode.
Hopefully, this helps in the journey for more reliable deployments across your cloud deployments.
To understand how to build more powerful queries, check these links:
- Sample queries for Azure Monitor (Microsoft Docs)
- Getting started with Kusto (Microsoft Docs)
- Using cross-resource query for multiple resources (Microsoft Docs)
Thanks for reading. Please leave a comment!
Comments are closed